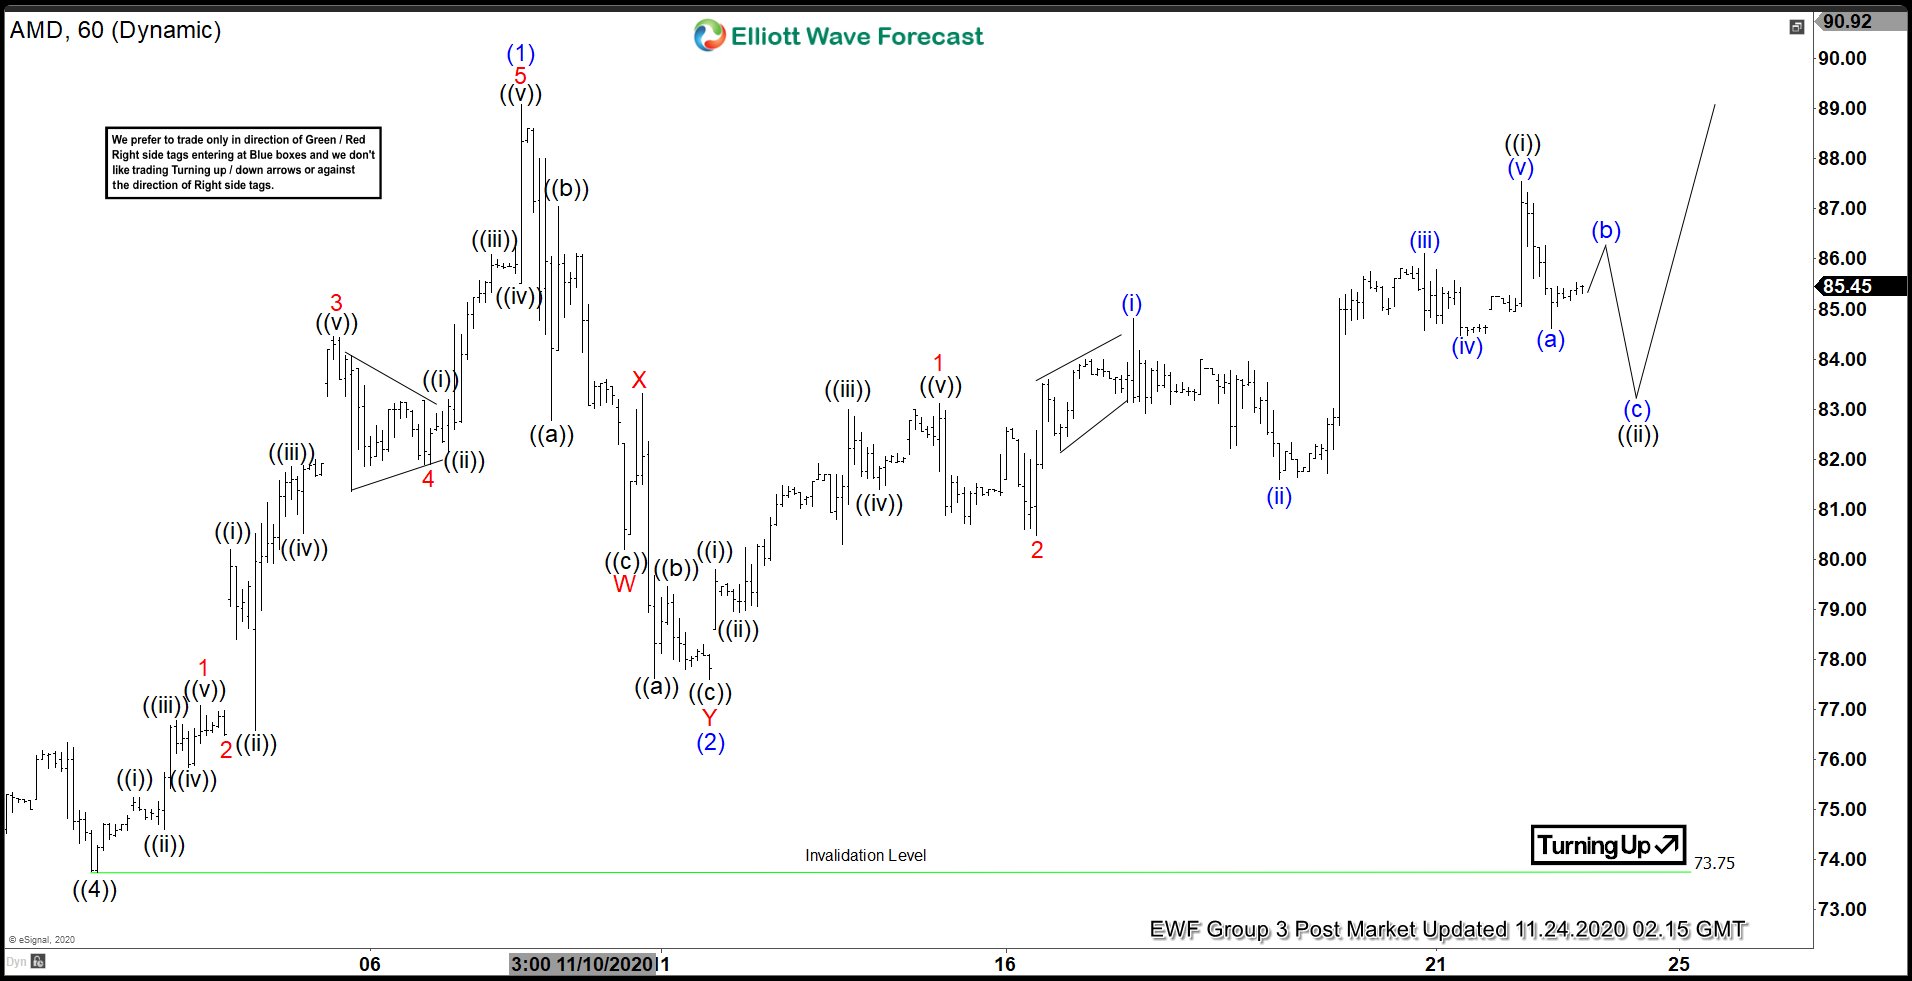
In this article we are going to review and analyze The Elliot’s Wave structure of the shares of Advanced Micro Devices Inc in the last days of November. Here’s the 1-hour AMD chart presented to our members on November 24th. After finishing a cycle as wave (2) at 77.56, we could see 5 waves up as wave 1 in red, then a zig-zag correction and another 5 waves up as wave ((i)). Thus, we looked for a movement to correct the cycle of wave ((i)) as simple as (a) (b) (c) correction to develop a wave ((ii)).
AMD Zig-Zag and Rally
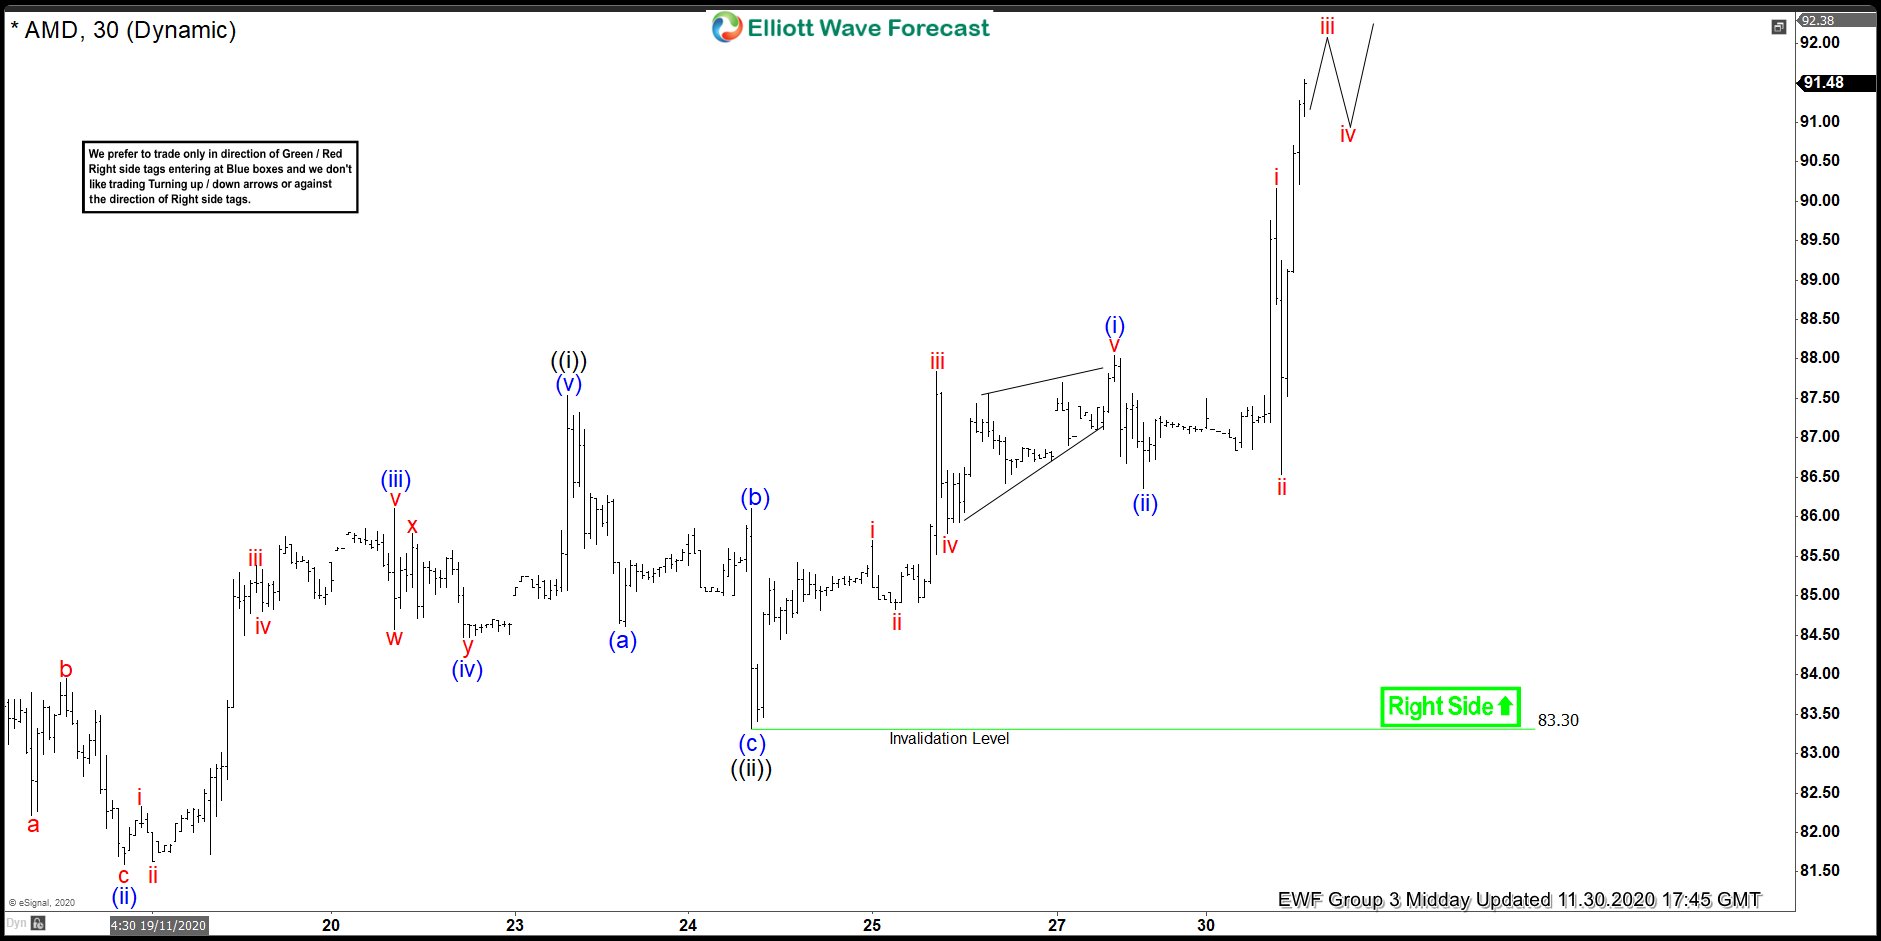
This is the chart of November 30 where we can see that the wave ((ii)) we were looking for performed a zig-zag Elliott wave correction, to have more information on Elliott Theory can visit the following link: Elliott’s Wave Theory. The market bounced back at 83.30 and continued with the uptrend following the right side of the market. We could see 5 waves developing an impulse as wave (i) and then a zig-zag correction as wave (ii). From here, the stock rally again and we are expecting more upside to complete wave (iii) and small correction as (iv) and one more high to complete a cycle from 83.30 level.
In Elliottwave Forecast we update the one-hour charts 4 times a day and the 4-hour charts once a day for all our 78 instruments and also the blue boxes and rigth side mark. We do a daily live session where we guide our clients on the right side of the market. In addition, we have a chat room where our moderators will help you with any questions you have about what is happening in the market at the moment. Let’s trial for 14 days totally free here: I want a free trial.
Back

