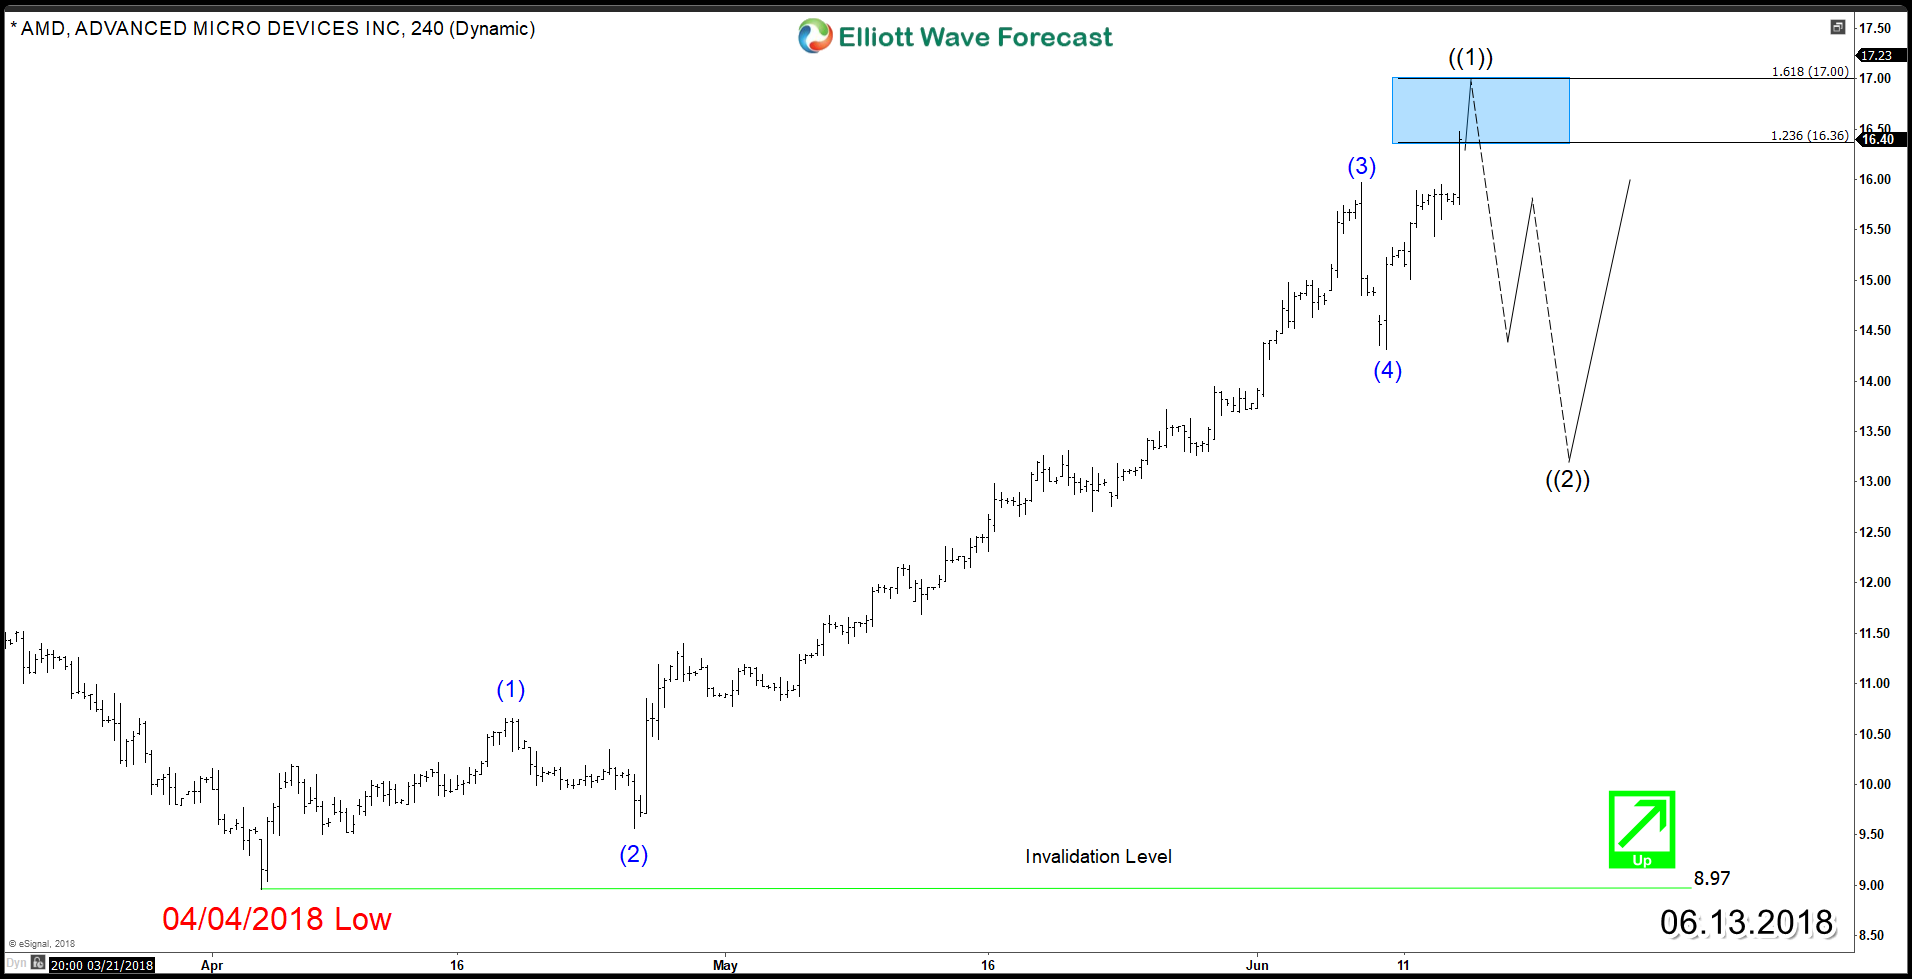
Since 2017 peak, Advanced Micro Devices (AMD: NASDAQ) has been lagging the move higher compared to its competitors. Despite a weak start of 2018 around the stock market, AMD managed to recover strongly since the 4th of April.
The semiconductor stock, starred a strong rally showing an impulsive 5 waves structure to the upside as you can see in the 4h chart :
AMD 4H Chart
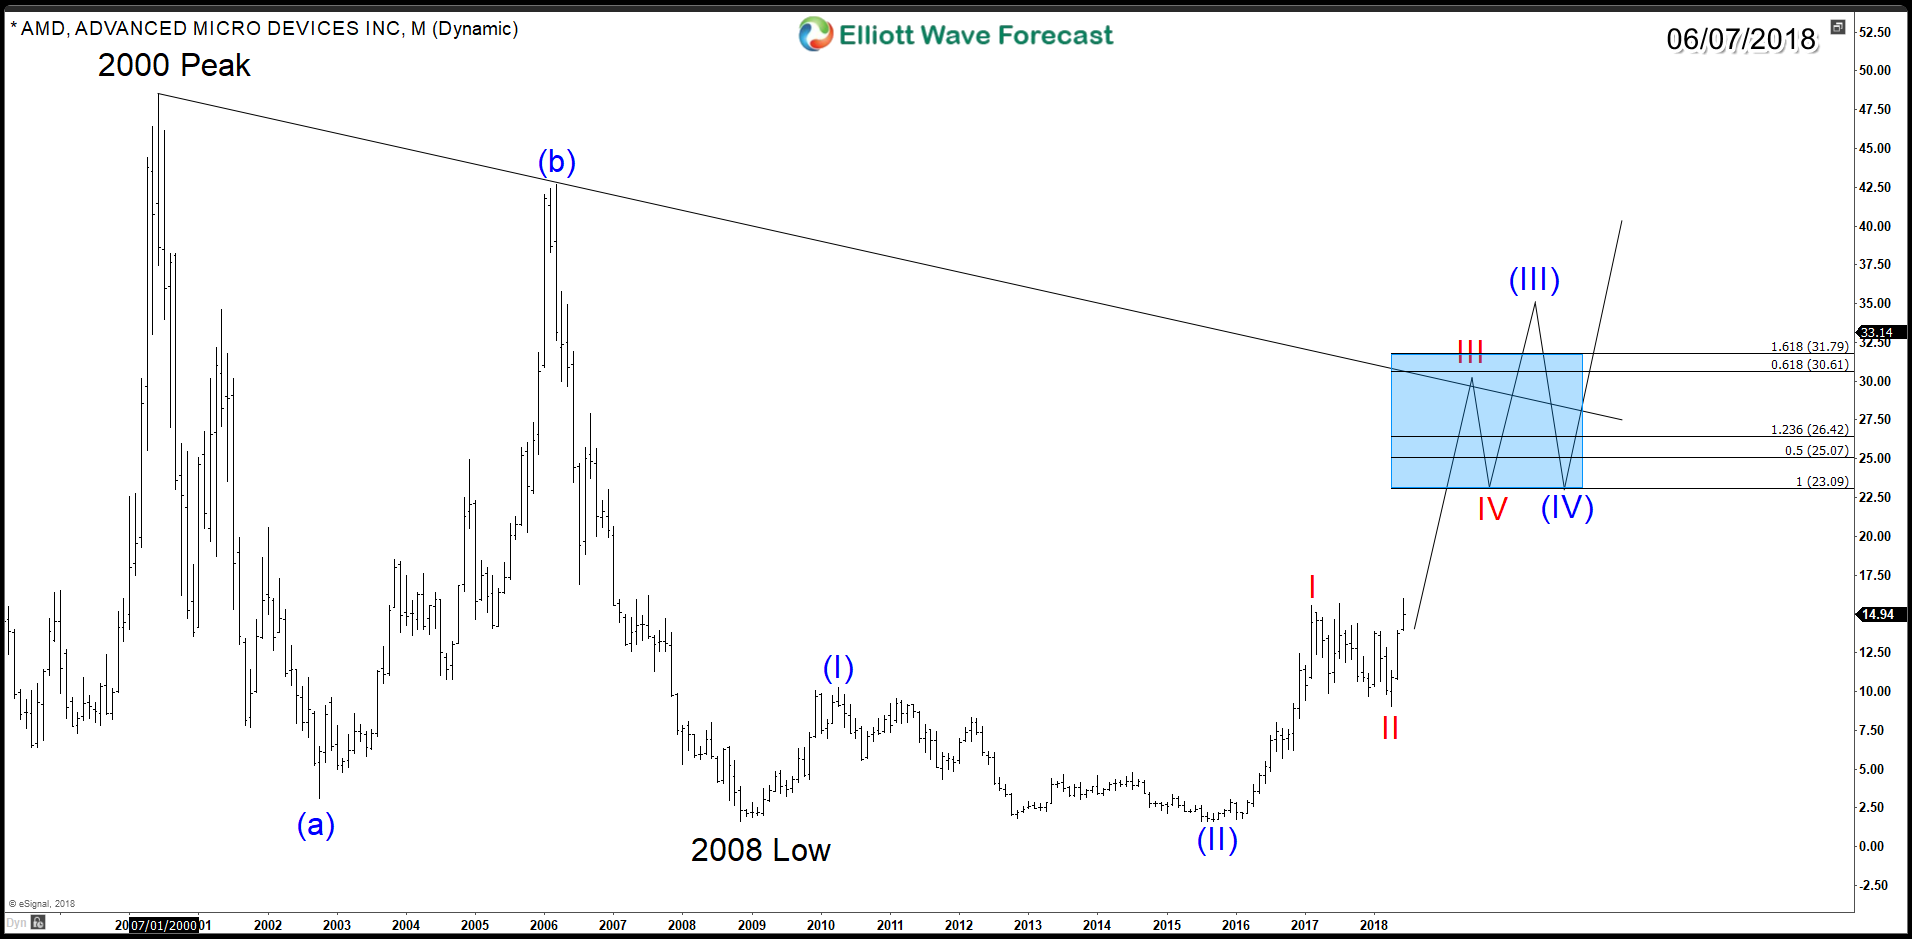
To understand the current move, we zoom out to the Monthly chart where we can present 2 scenarios that can take place from current levels. The main idea for the stock, since 2000 peak (dot com bubble) it did big 3 waves pullback that ended in 2008 low. It also managed to hold that low during the 2015 pullback and been rallying since then.
AMD Monthly Chart ( Impulse )
The aggressive bullish scenario is suggesting a nest taking place from 2018 low. In that case, AMD started wave III of (III) which is the strongest leg within the bullish cycle and can take the stock higher above 100% area $23.09.
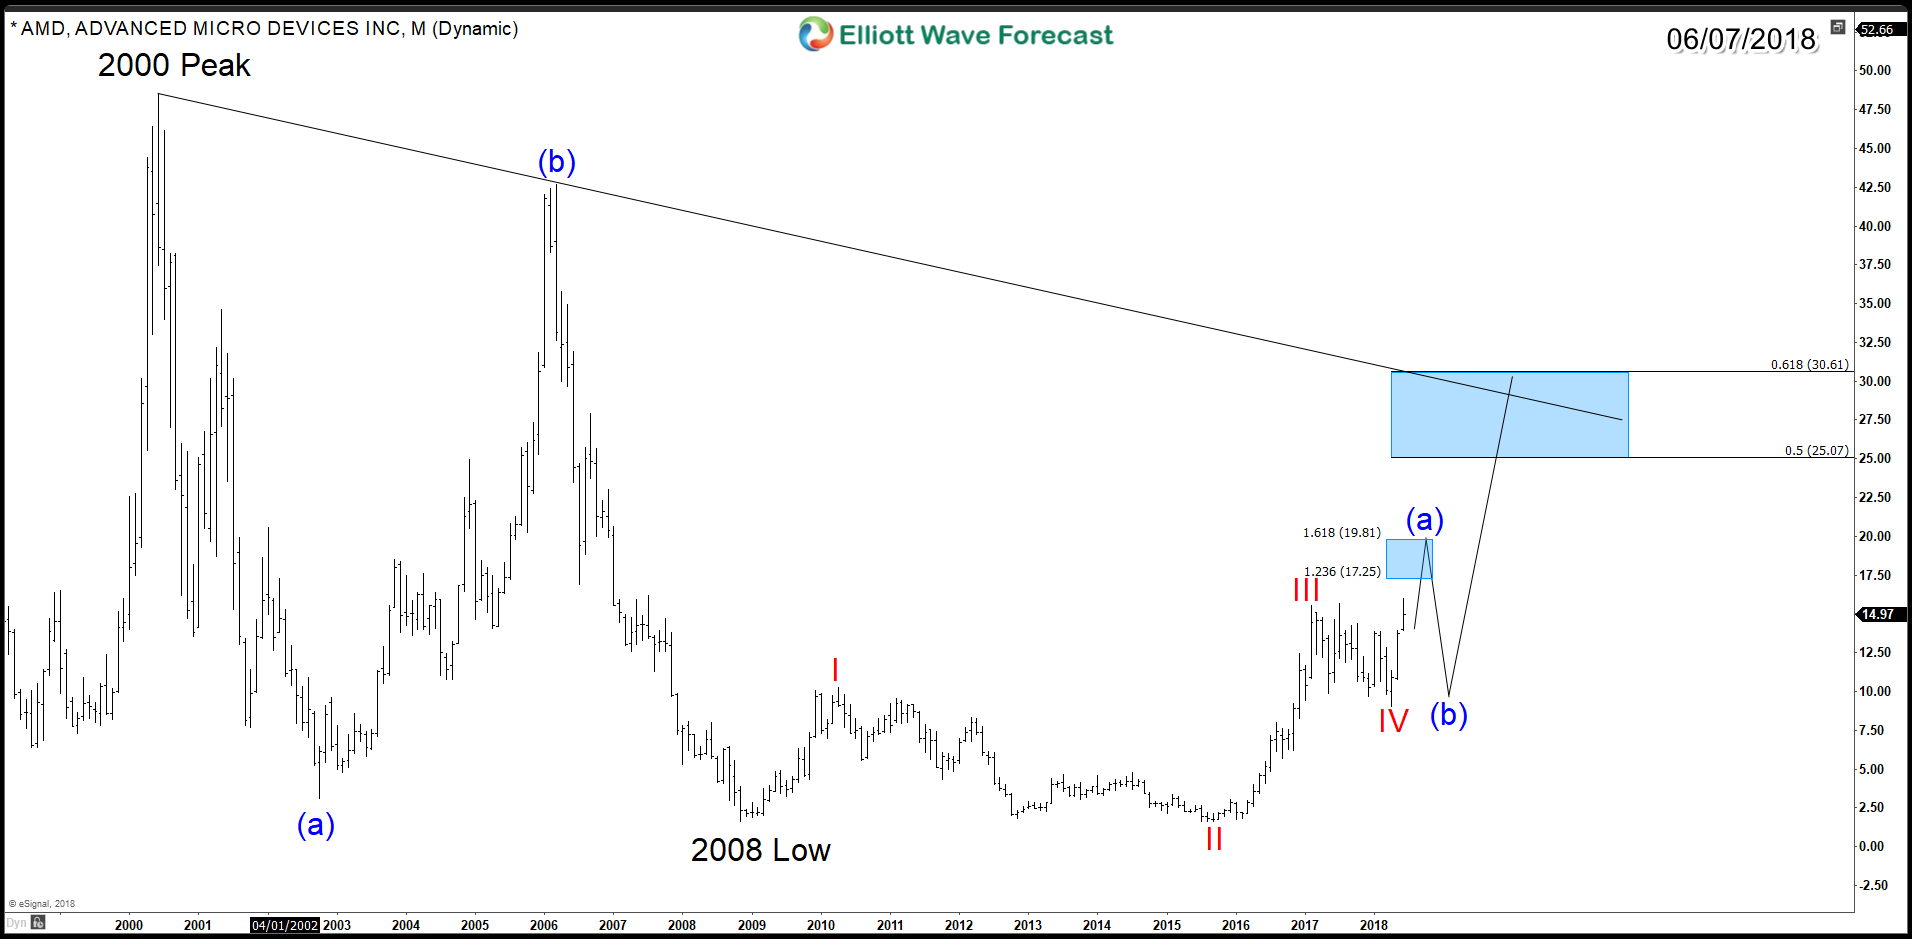
AMD Monthly Chart ( Zigzag )
The less aggressive view is suggesting that AMD is looking to finish 5 waves from 2018 low after reaching short term target area $17.25 – $19.81, then it will correct lower in 3 waves pullback before a new 5 waves higher take place to finish a 3 waves zigzag structure around 50%_61.8% area $25.07 – $30.61.
Conclusion
Advanced Micro Devices have the potential of a move higher toward $25 area in 2 different scenarios as the stock is still correcting the decline from 2000 peak. Pullbacks at current stage are expected to remain supported in 3 , 7 or 11 swings where buyer can jump in looking for new highs or 3 waves bounce at least.
For further insights about Intel or other technology stocks then take this opportunity and try our services 14 days to learn how to trade Stocks and ETFs using our blue boxes and the 3, 7 or 11 swings sequence. You will get access to our 78 instruments updated in 4 different time frames, Live Trading & Analysis Session done by our Expert Analysts every day, 24-hour chat room support and much more.
Back


