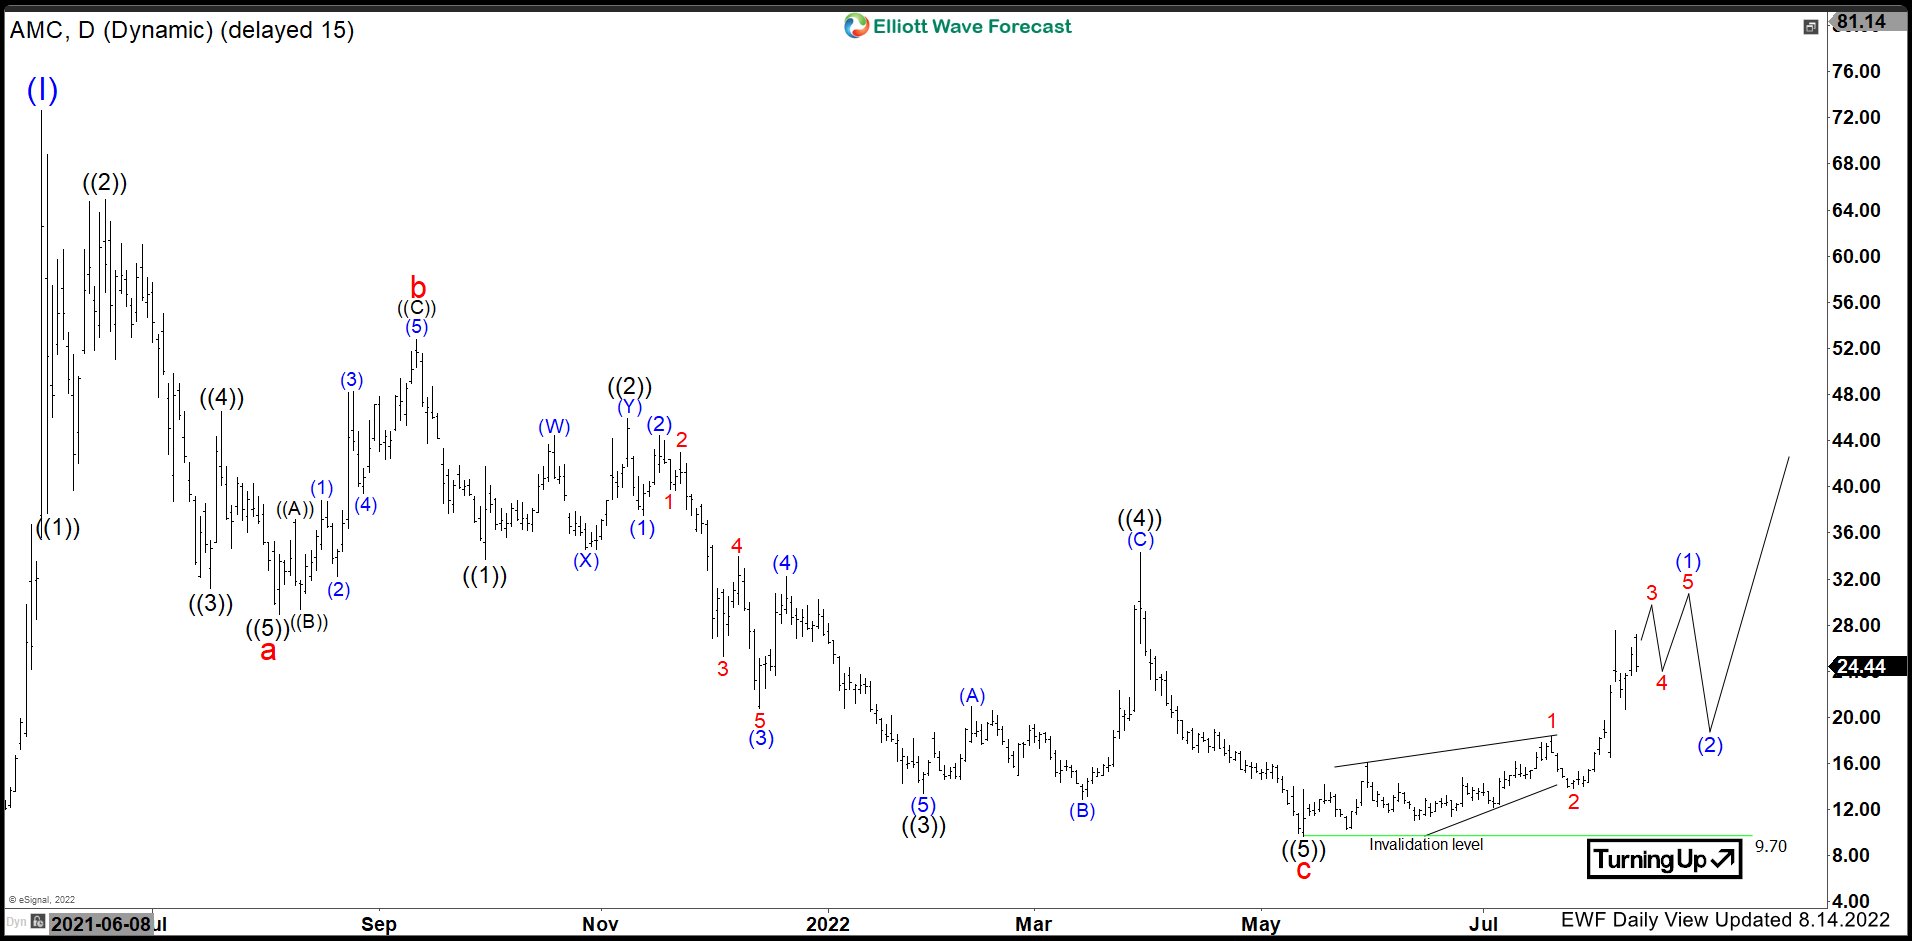
Good day Traders and Investors. In today’s article, we are going to take a look at the Elliott Wave path in AMC Theatres ($AMC).
AMC Theatres ($AMC) is an American movie theater chain headquartered in Leawood, Kansas, and the largest movie theater chain in the world. Founded in 1920, AMC has the largest share of the U.S. theater market ahead of Regal and Cinemark Theatres. It has 2,807 screens in 353 theatres in Europe and 7,755 screens in 593 theatres in the United States.
AMC Elliottwave Latest View (Daily):
The Daily Chart above shows the cycle from June 2021 peak at $72.62 unfold in a corrective zigzag structure (abc). We have the first 5 swings in red a followed by a bounce in b that peaked in September 2021. Red c went on and also unfolded in a 5 swing structure with an expanded flat in the wave ((4)) connector to reach $9.70 on May 12th, 2022 at ((5) of c. It missed the Daily Blue box area from the all time peak which came at $9.07. However the bounce from May 12th, 2022 at $9.70 appears to be impulsive taking the march 29th pivot and breaking above the Daily RSI channel from the all-time peak. As long as price remains above 05/12/2022 low at $9.70, the low can be in place and the stock is favoured to keep extending higher.
Risk Management
Using proper risk management is absolutely essential when trading or investing in volatile stocks. Elliott Wave counts can evolve quickly, be sure to have your stops in and define your risk when trading.
Elliott Wave Forecast
We cover 78 instruments in total, but not every chart is a trading recommendation. We present Official Trading Recommendations in the Live Trading Room. If not a member yet, Sign Up for Free 14 days Trial now and get access to new trading opportunities. Through time we have developed a very respectable trading strategy. It defines Entry, Stop Loss and Take Profit levels with high accuracy.
Welcome to Elliott Wave Forecast!
Back

