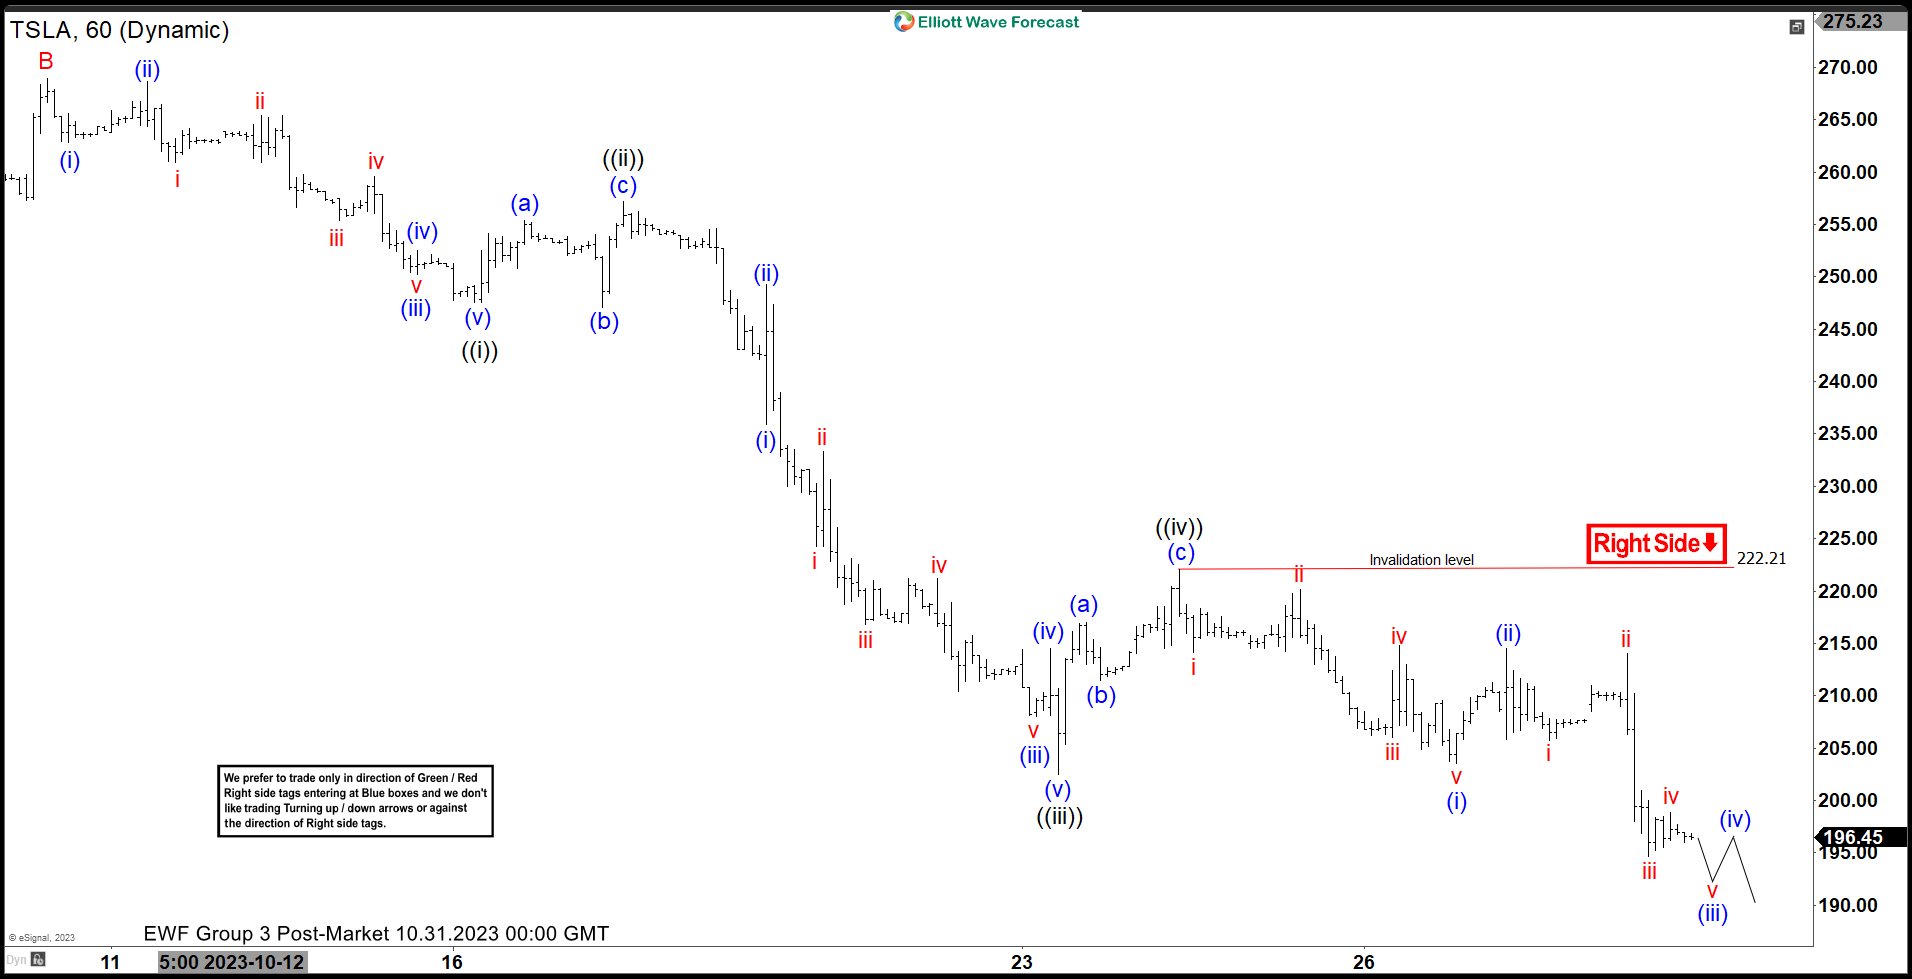
The Short-term Elliott wave view in the Tesla stock ticker symbol: TSLA is doing a pullback from the 19 July 2023 peak to correct the cycle from the 06 January 2023 low. The pullback from the peak is unfolding as Elliott wave double three structure where wave (W) ended in 3 swings at $212.36 low. Up from there, the stock made a 3-wave bounce higher in wave (X) towards 278.98 high. Down from there, the stock is expected to extend lower in wave (Y). Looking to reach the extreme from the peak towards the $191.90- $138.11 area. Before a bounce in a minimum of 3 waves is expected to happen.
While the internals of (Y) leg lower is taking the form of a lesser degree zigzag correction where wave A ended at $234.58 low. From there, wave B bounce ended at $268.94 high and now wave C remains in progress in an impulse sequence. Below from there, wave ((i)) ended in a lesser degree 5 waves at a $247.50 low. Then a bounce to $257.18 high ended wave ((ii)). Wave ((iii)) ended at $202.51 low in a lesser degree 5 waves. Whereas wave ((iv)) ended at $222.21 high. Near-term, as far as bounces fail below $222.21 high the stock is expected to extend lower in wave ((v)). Towards 0.618%- 0.764% Fibonacci extension area of wave ((i)) – ((iii)) at $180.93- $171.20 area before a turn happens.


