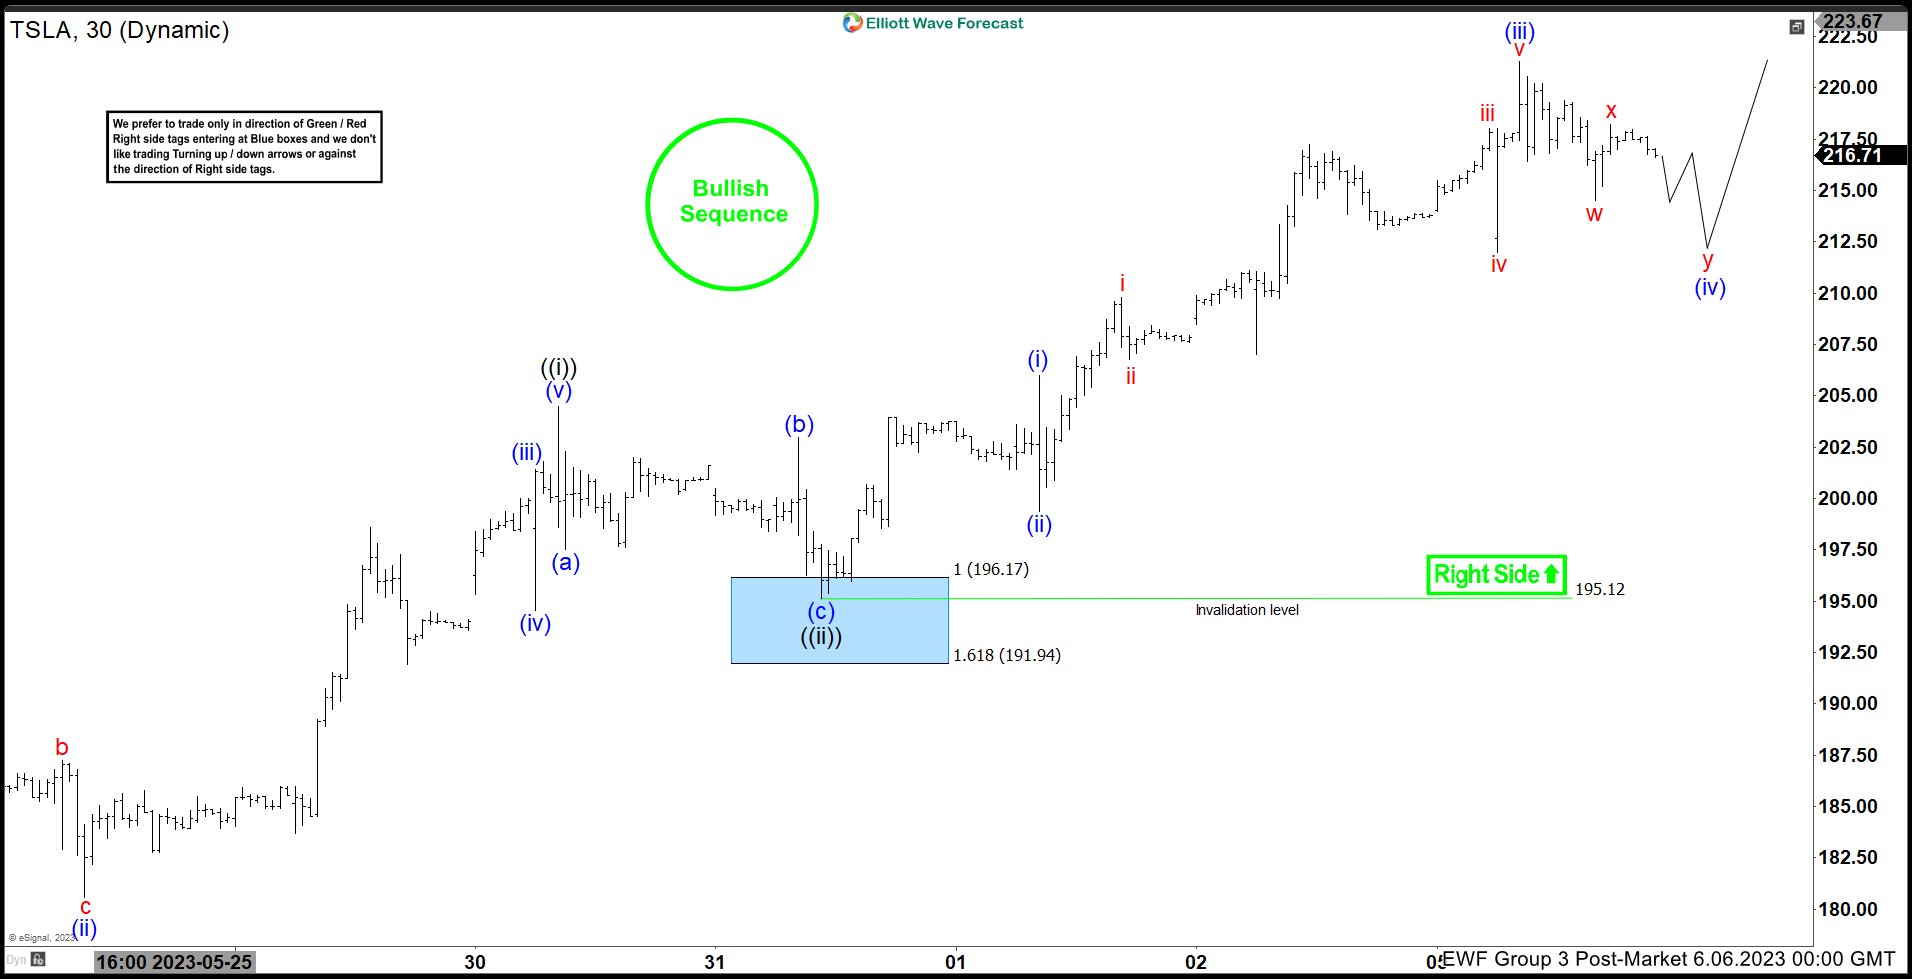
Tesla (TSLA) has broken above 2.16.2023 peak at 217.65. The stock now shows a bullish sequence from 1.6.2023 low favoring further upside. Near term, cycle from 5.24.2023 low is currently in progress as a 5 waves impulse with extension Elliott Wave structure. Up from 5.24.2023 low, wave ((i)) ended at 204.48 and dips in wave ((ii)) ended at 195.12. Internal subdivision of wave ((ii)) unfolded as a zigzag structure. Down from wave ((i)), wave (a) ended at 197.53, wave (b) ended at 202.99, and wave (c) lower ended at 195.12. This completed wave ((ii)) in larger degree. The stock then resumes higher in wave ((iii)).
Up from wave ((ii)), wave (i) ended at 205.99 and pullback in wave (ii) ended at 199.37. Tesla then extends higher in wave (iii) with internal subdivision as another impulse in lesser degree. Up from wave (ii), wave i ended at 209.8 and dips in wave ii ended at 206.78. Wave iii ended at 218, pullback in wave iv ended at 212, and final leg wave v ended at 221.29 which completed wave (iii). Pullback in wave (iv) is now in progress in 7 swing and can reach 207 – 211 area before finding support for further upside. As far as pivot at 195.12 low stays intact, expect pullback to find support in 3, 7, 11 swing for further upside.


