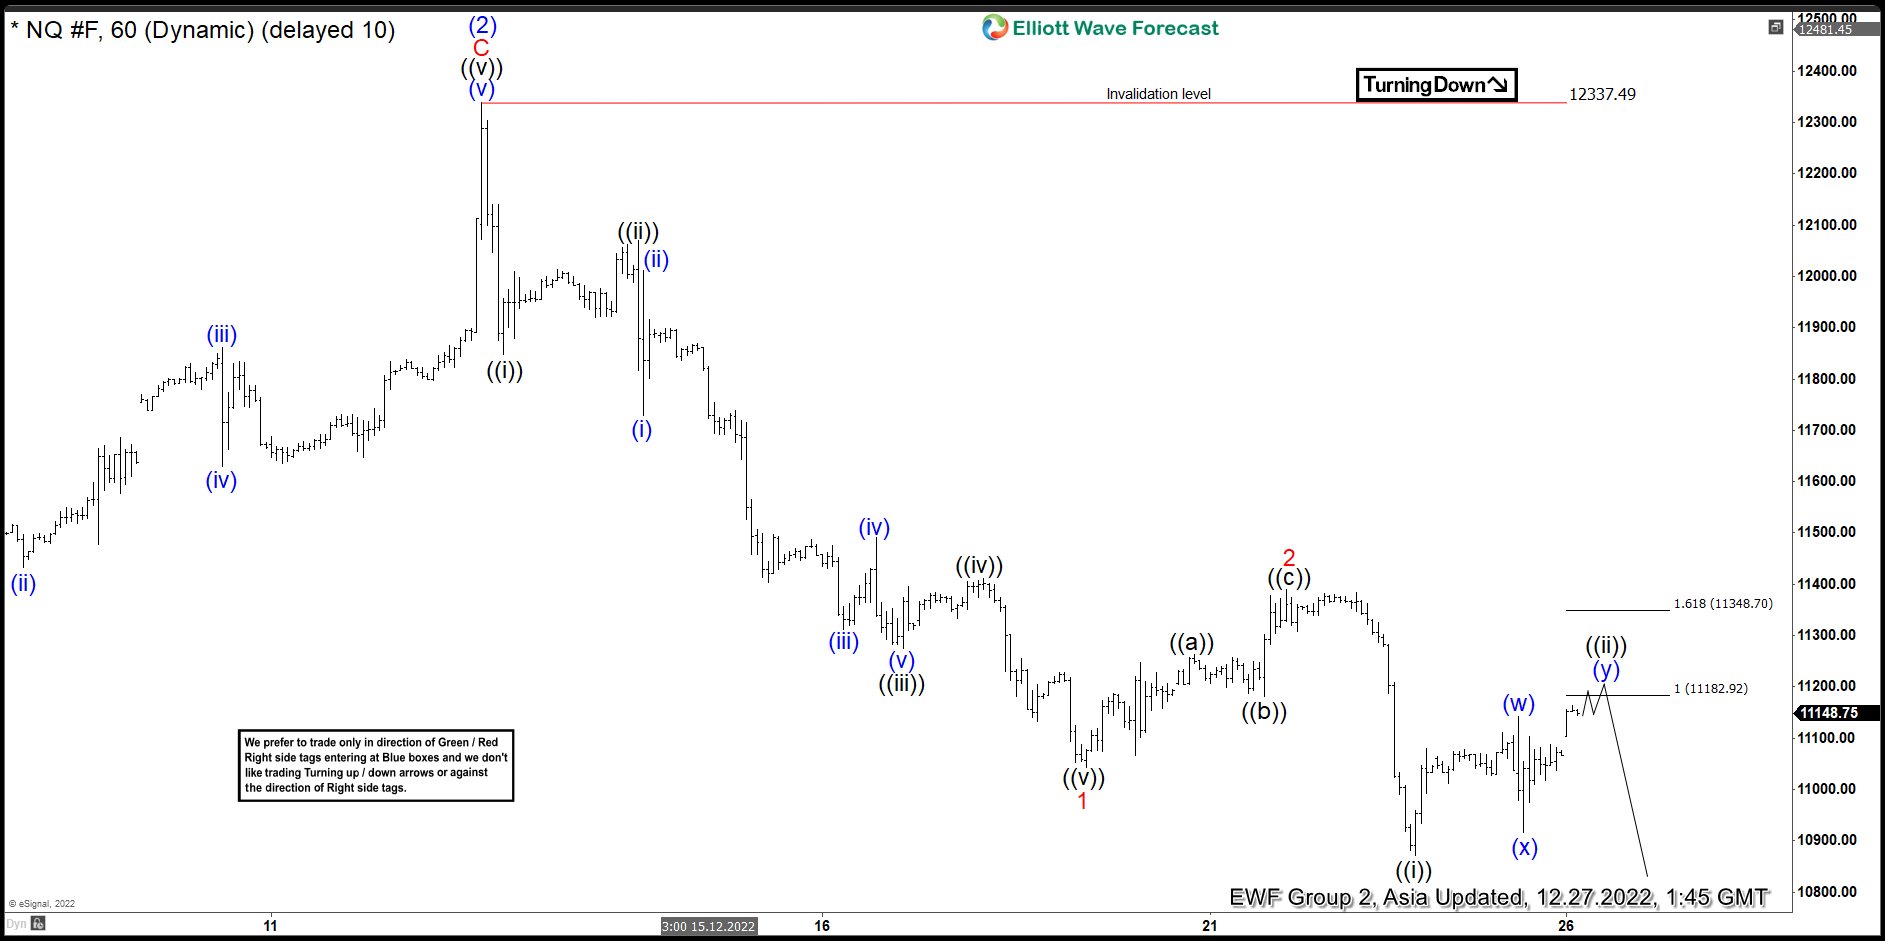
Short term, Elliott wave view in Nasdaq (NQ) suggests that the decline from 8.16.2022 high is unfolding as a 5 waves impulse Elliott Wave structure. Down from 8.16.2022 high, wave (1) ended at 10890.75 and rally in wave (2) ended at 12339. Internal subdivision of wave (2) unfolded as an expanded Flat structure where wave A ended at 11729.75 and pullback in wave B ended at 10484.75. Final leg wave C ended at 12337.49 which completed wave (2). Index then resumes lower from there in wave (3). Down from wave (2), wave ((i)) ended at 11847 and rally in wave ((ii)) ended at 12069.50. Index resumes lower in wave ((iii)) towards 11275, wave ((iv)) ended at 11411, and final leg lower wave ((v)) ended at 11043.50. This completed wave 1 in higher degree.
Wave 2 corrective rally ended at 11389.75 with internal subdivision as a zigzag structure. Up from wave 1, wave ((a)) ended at 11263.75 and pullback in wave ((b)) ended at 11181. Final leg higher wave ((c)) ended at 11389.75 which completed wave 2. The Index resumes lower in wave 3 with internal subdivision as another impulse. Down from wave 2, wave ((i)) ended at 10870.50. As far as rally fails below wave 2 at 11389.75 and more importantly below wave (2) high at 12337.49, expect the Index to extend lower.


