
-
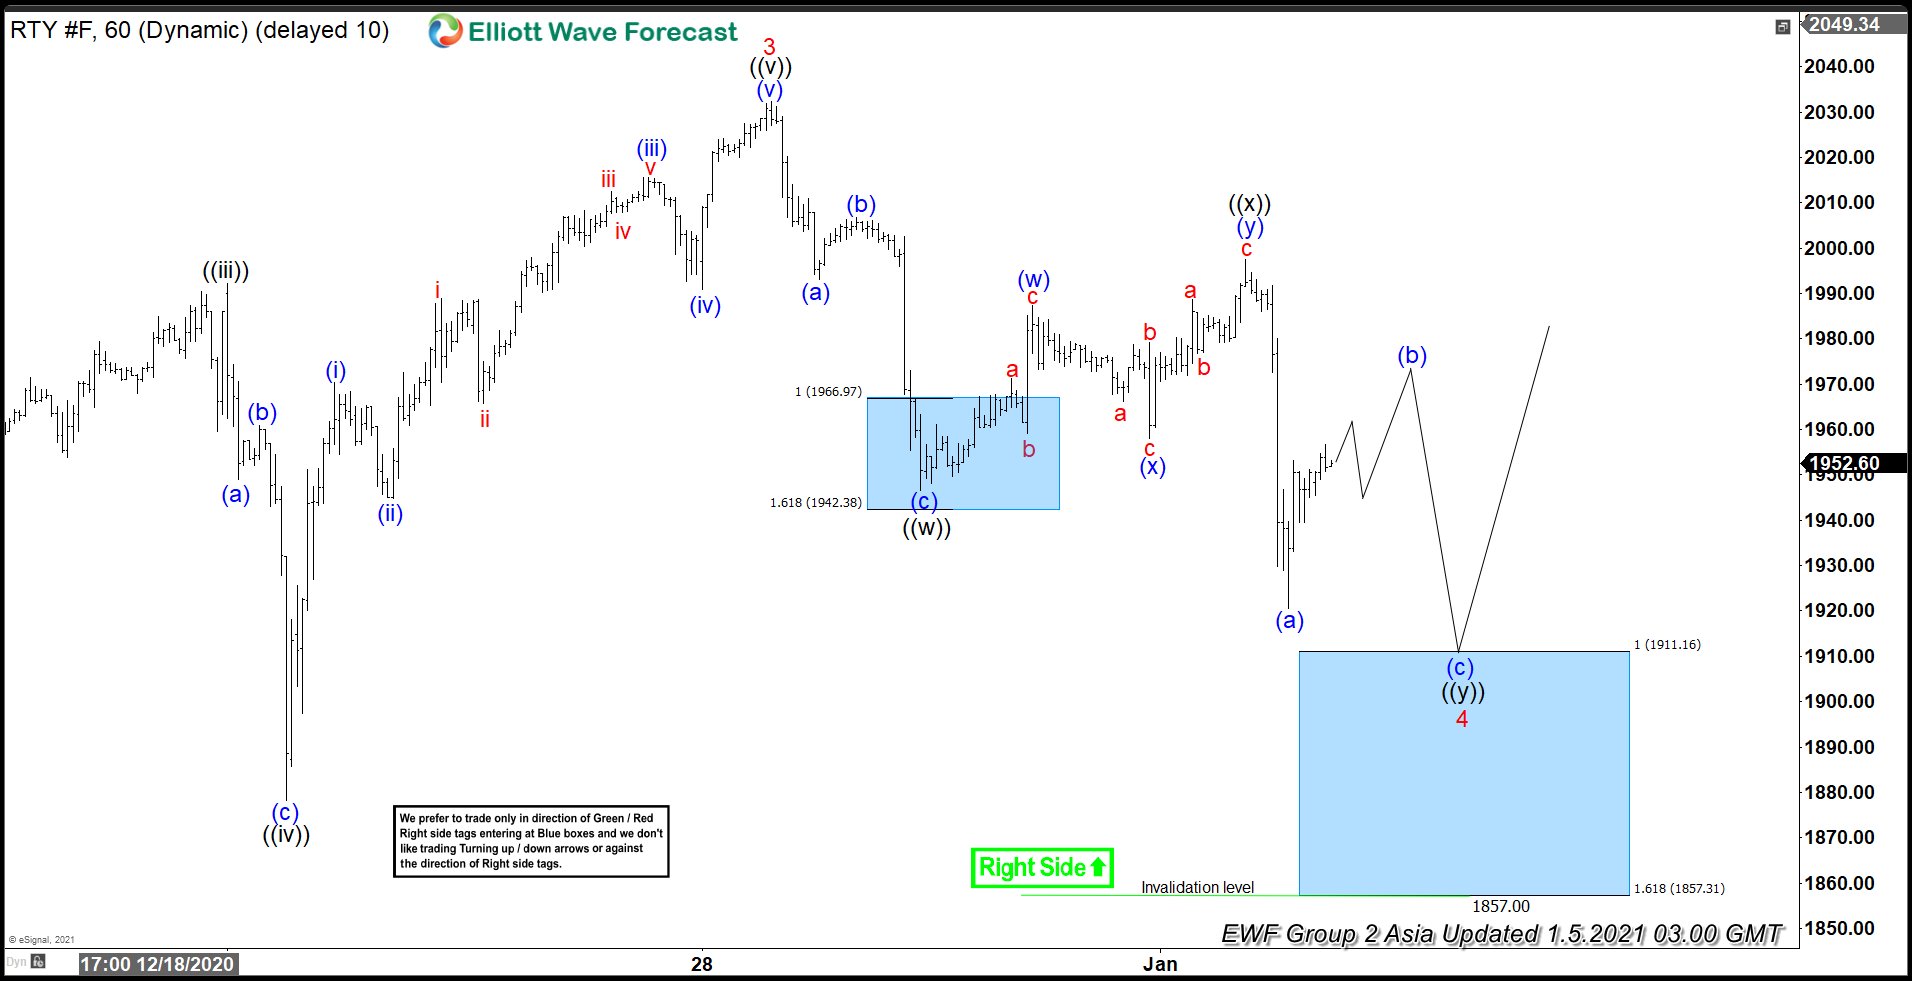
Elliott Wave View: Support Areas for Russell 2000
Read MoreRussell is currently correcting in a double three (double zigzag). This article and video look at potential support areas using Elliott Wave.
-
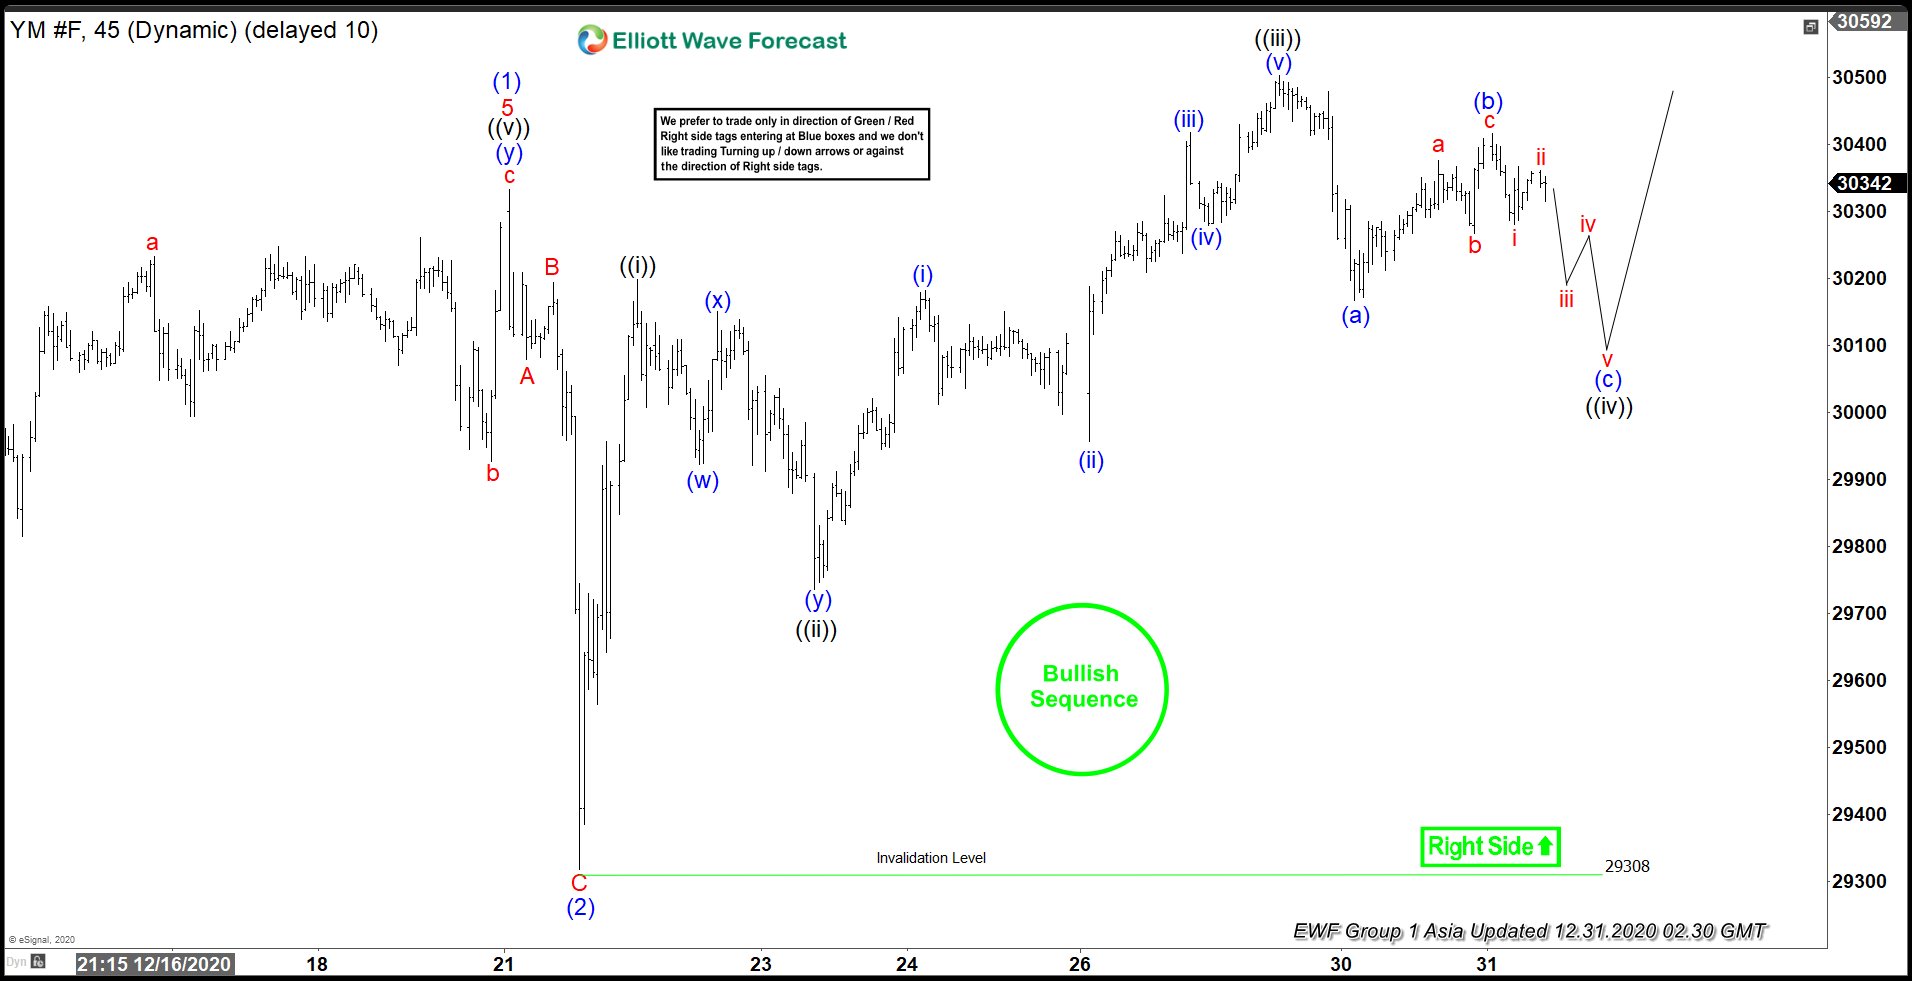
Elliott Wave View: Dow Futures (YM) Remains Bullish as We End Year 2020
Read MoreDow Future is near all-time high as we end year 2020. Structure of the Index remains bullish as this article and video explains using Elliott Wave.
-
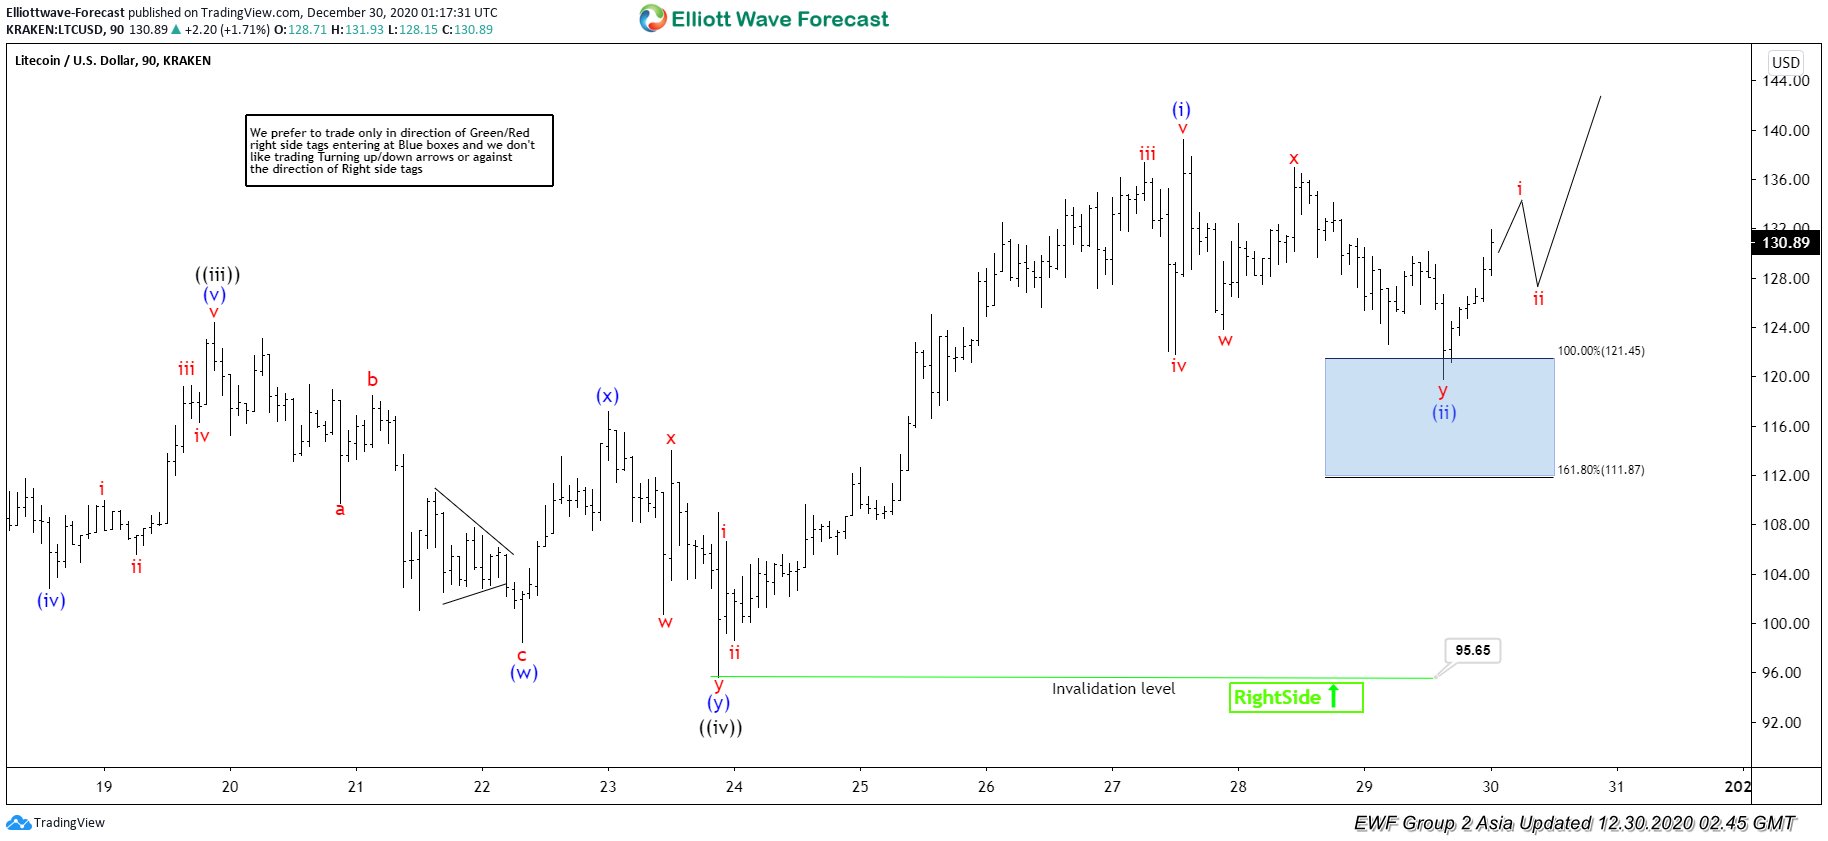
Elliott Wave View: Litecoin Ending Year 2020 on a High Note
Read MoreLitecoin and other crypto currency should end year 2020 on a high note. This article and video look at the Elliott Wave path.
-
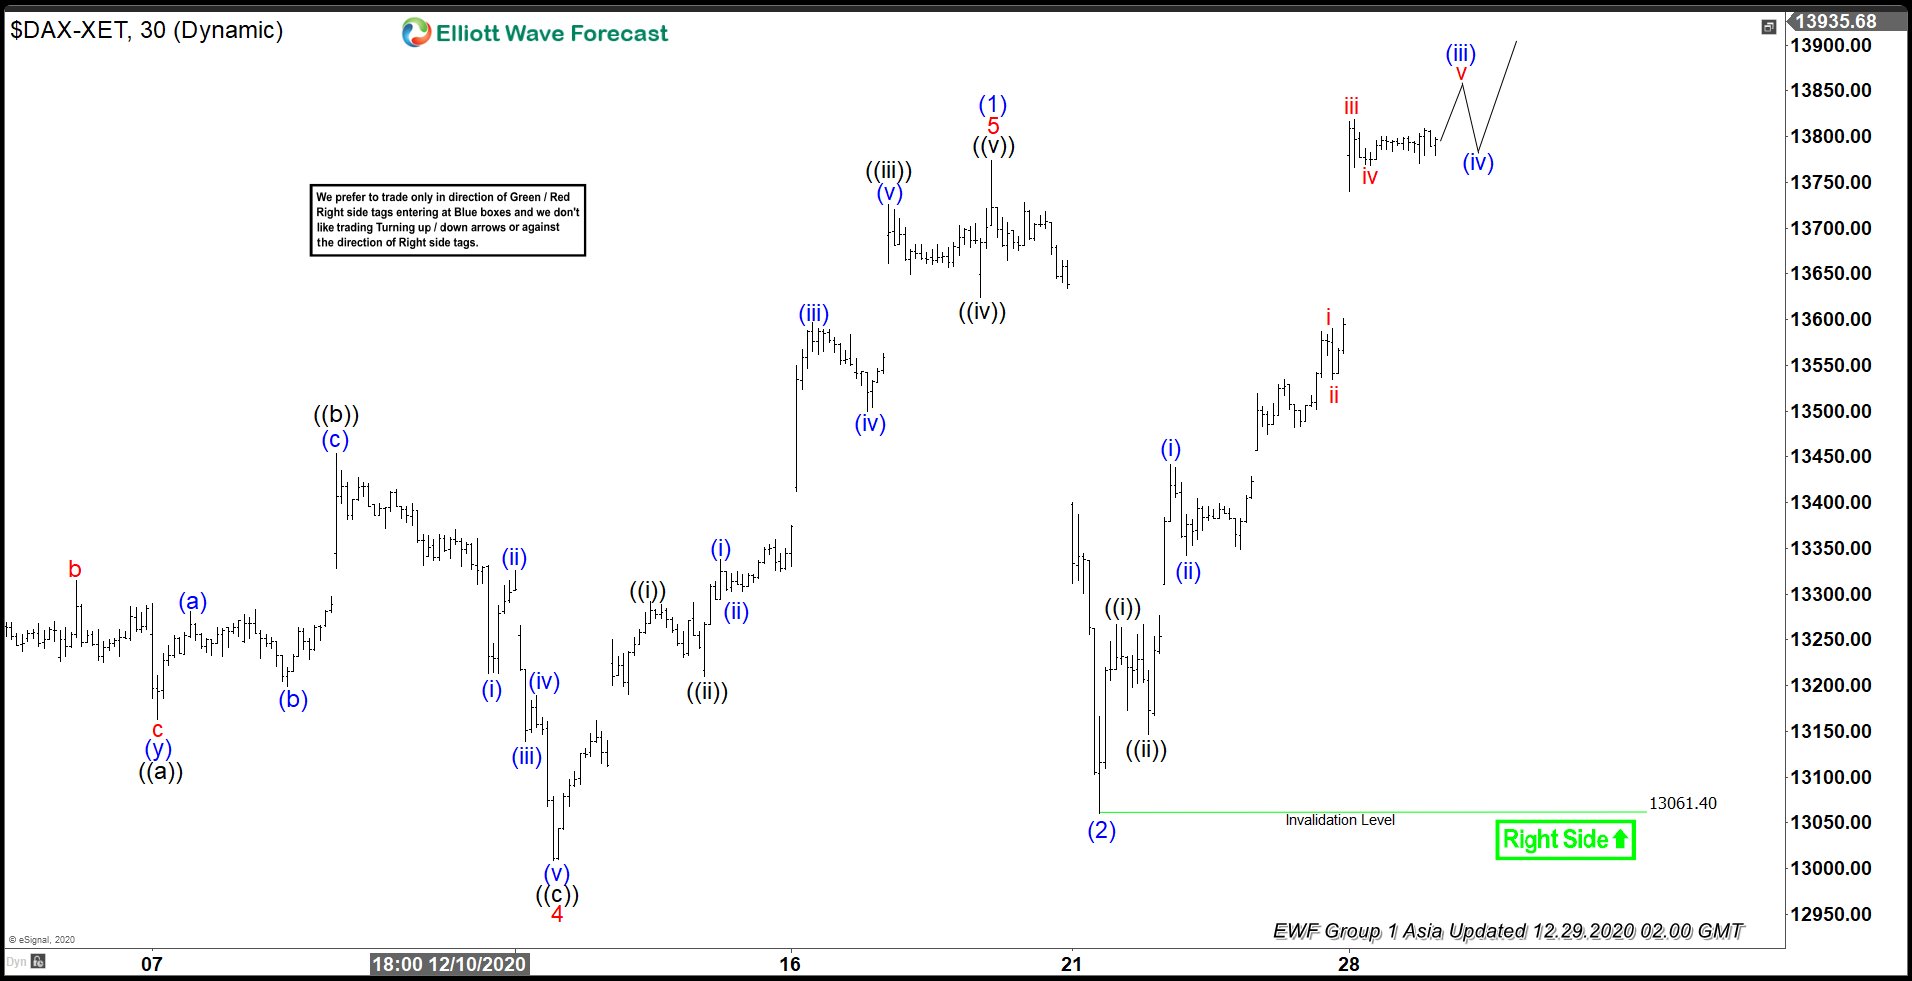
Elliott Wave View: DAX Starts a New Bullish Cycle
Read MoreDAX has started a new bullish cycle and dips should find support in 3, 7, or 11 swing. This article and video look at the Elliott Wave path.
-
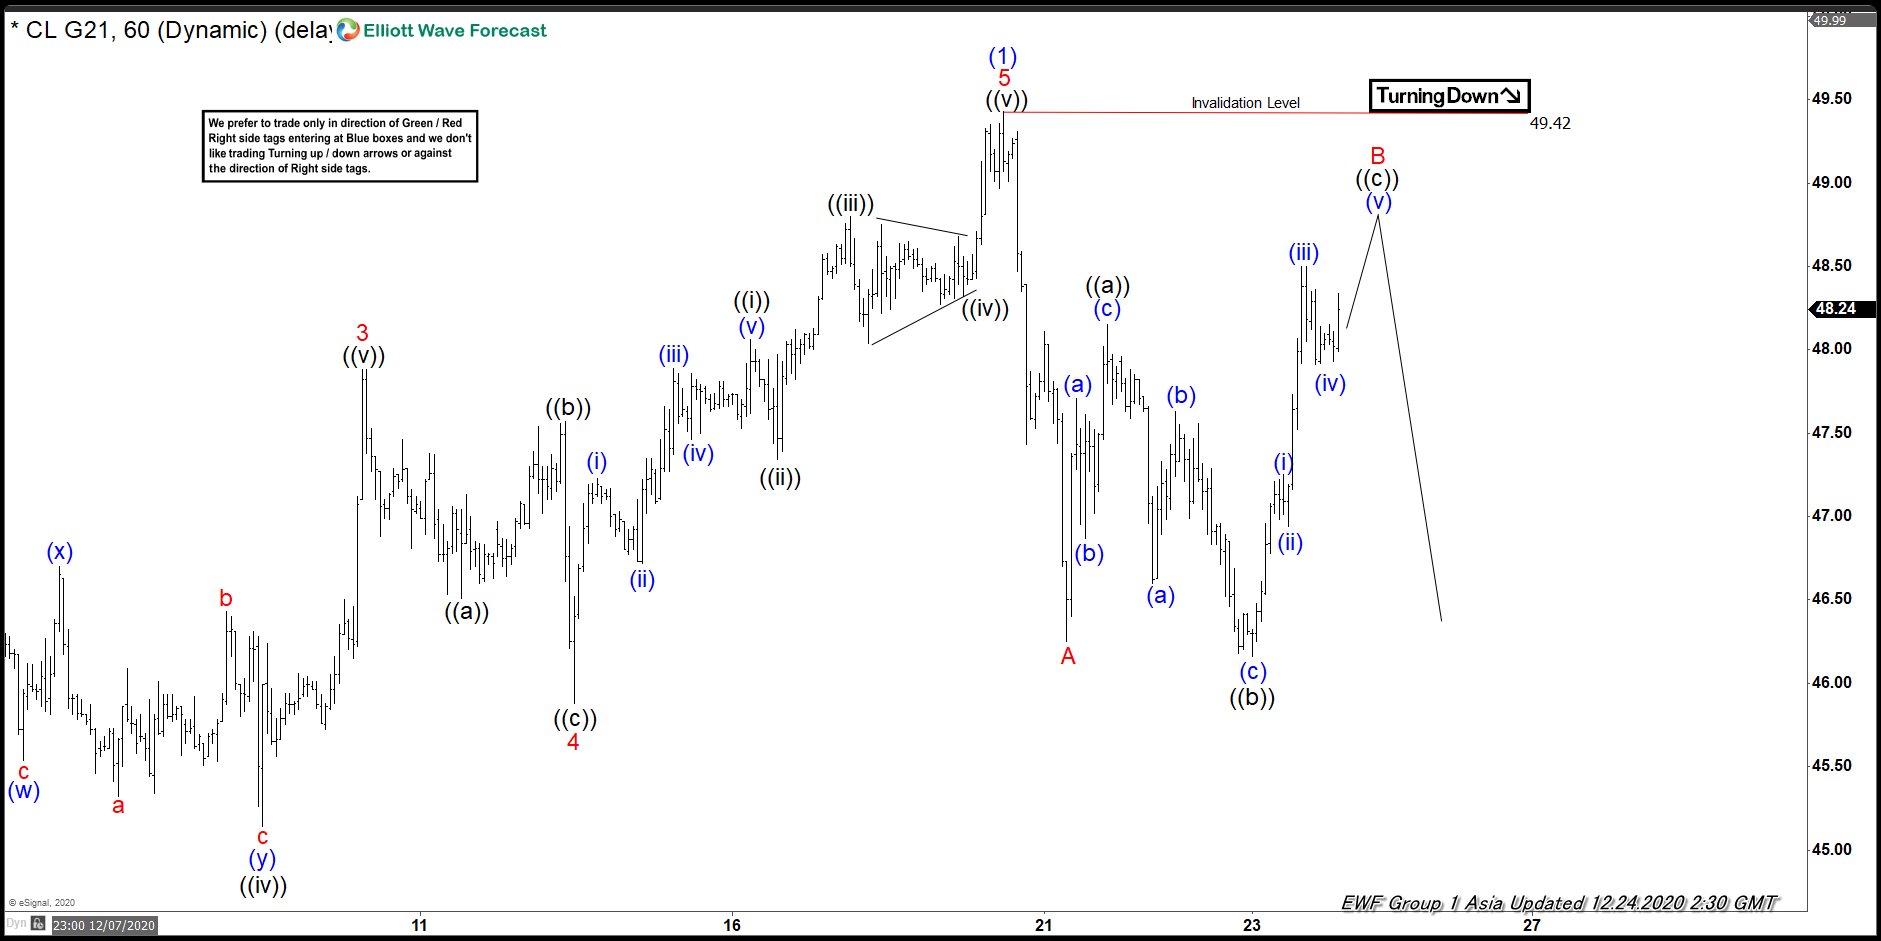
Elliott Wave View: OIL Can Extend Lower In Correction
Read MoreOIL is correcting the cycle from 11/01/2020 low & expected to extend lower in a correction. This video looks at the Elliott Wave path.
-
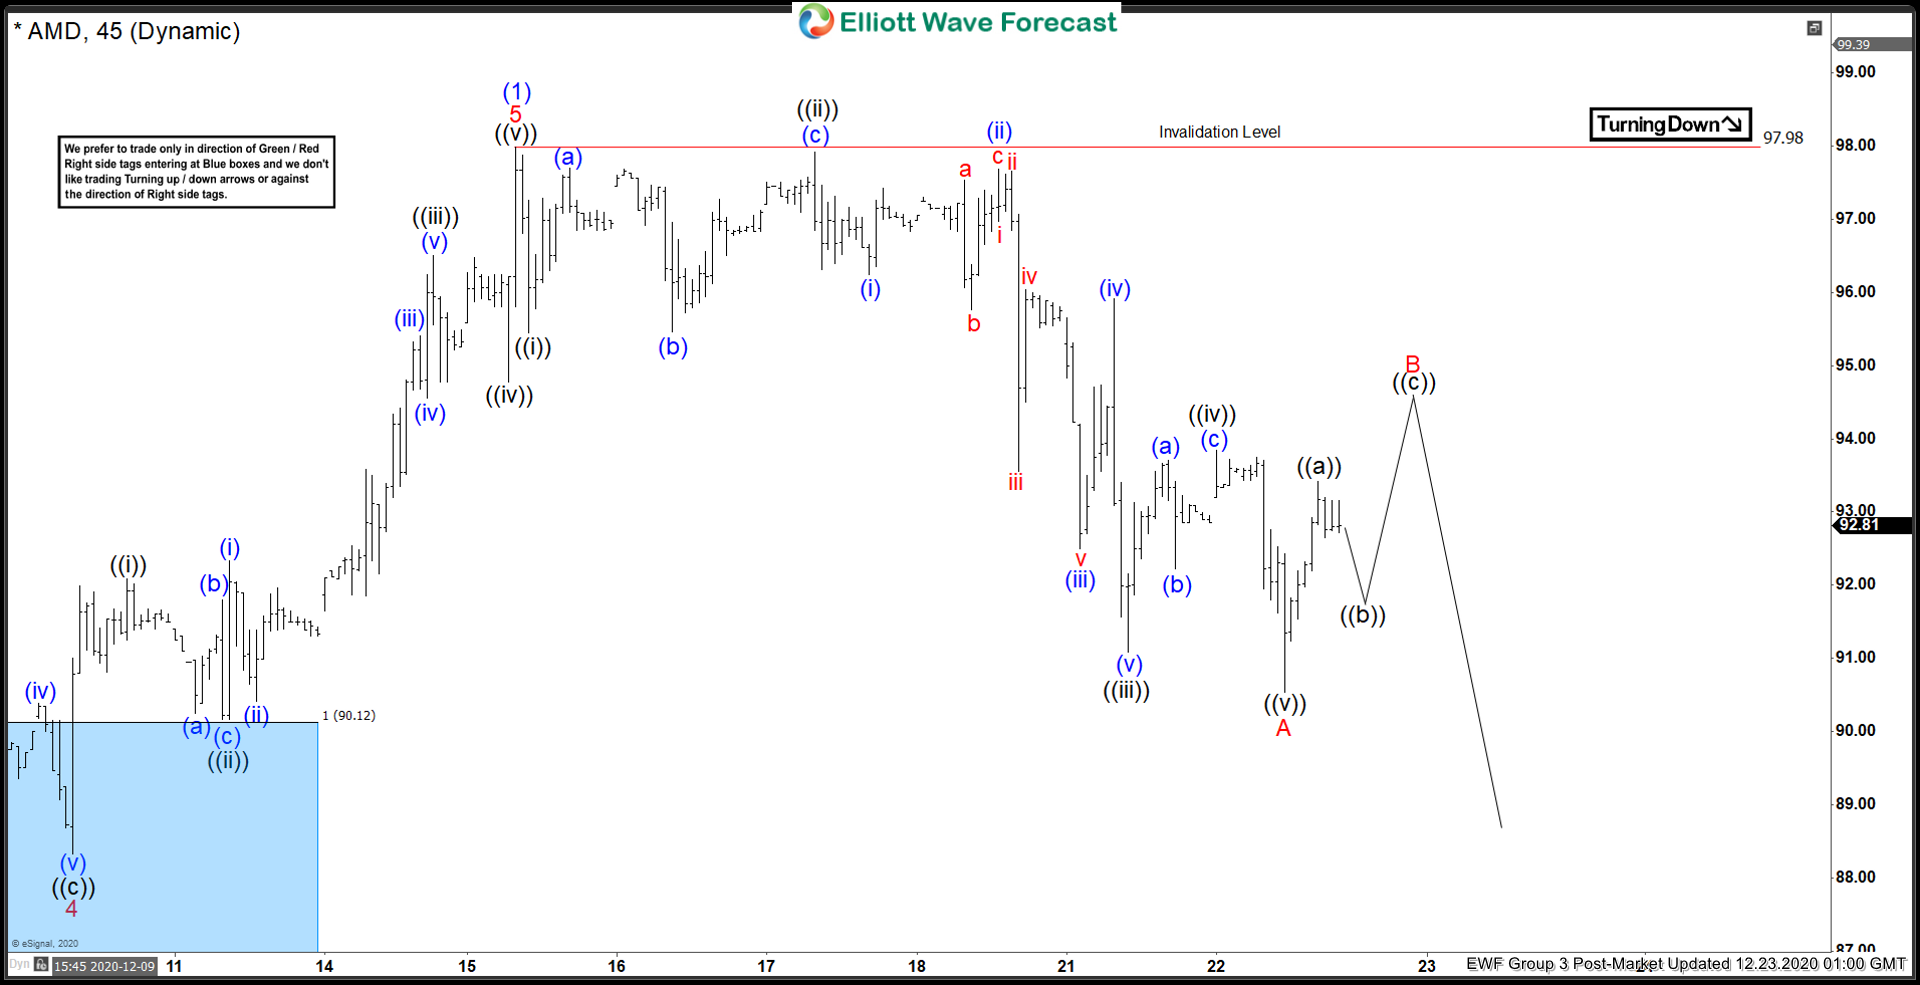
Elliott Wave View: AMD Pullback Another Buying Opportunity
Read MoreAMD is correcting the cycle from 11/02/2020 cycle & soon it is expected to provide another buying opportunity. This video looks at the Elliott Wave path.