
-
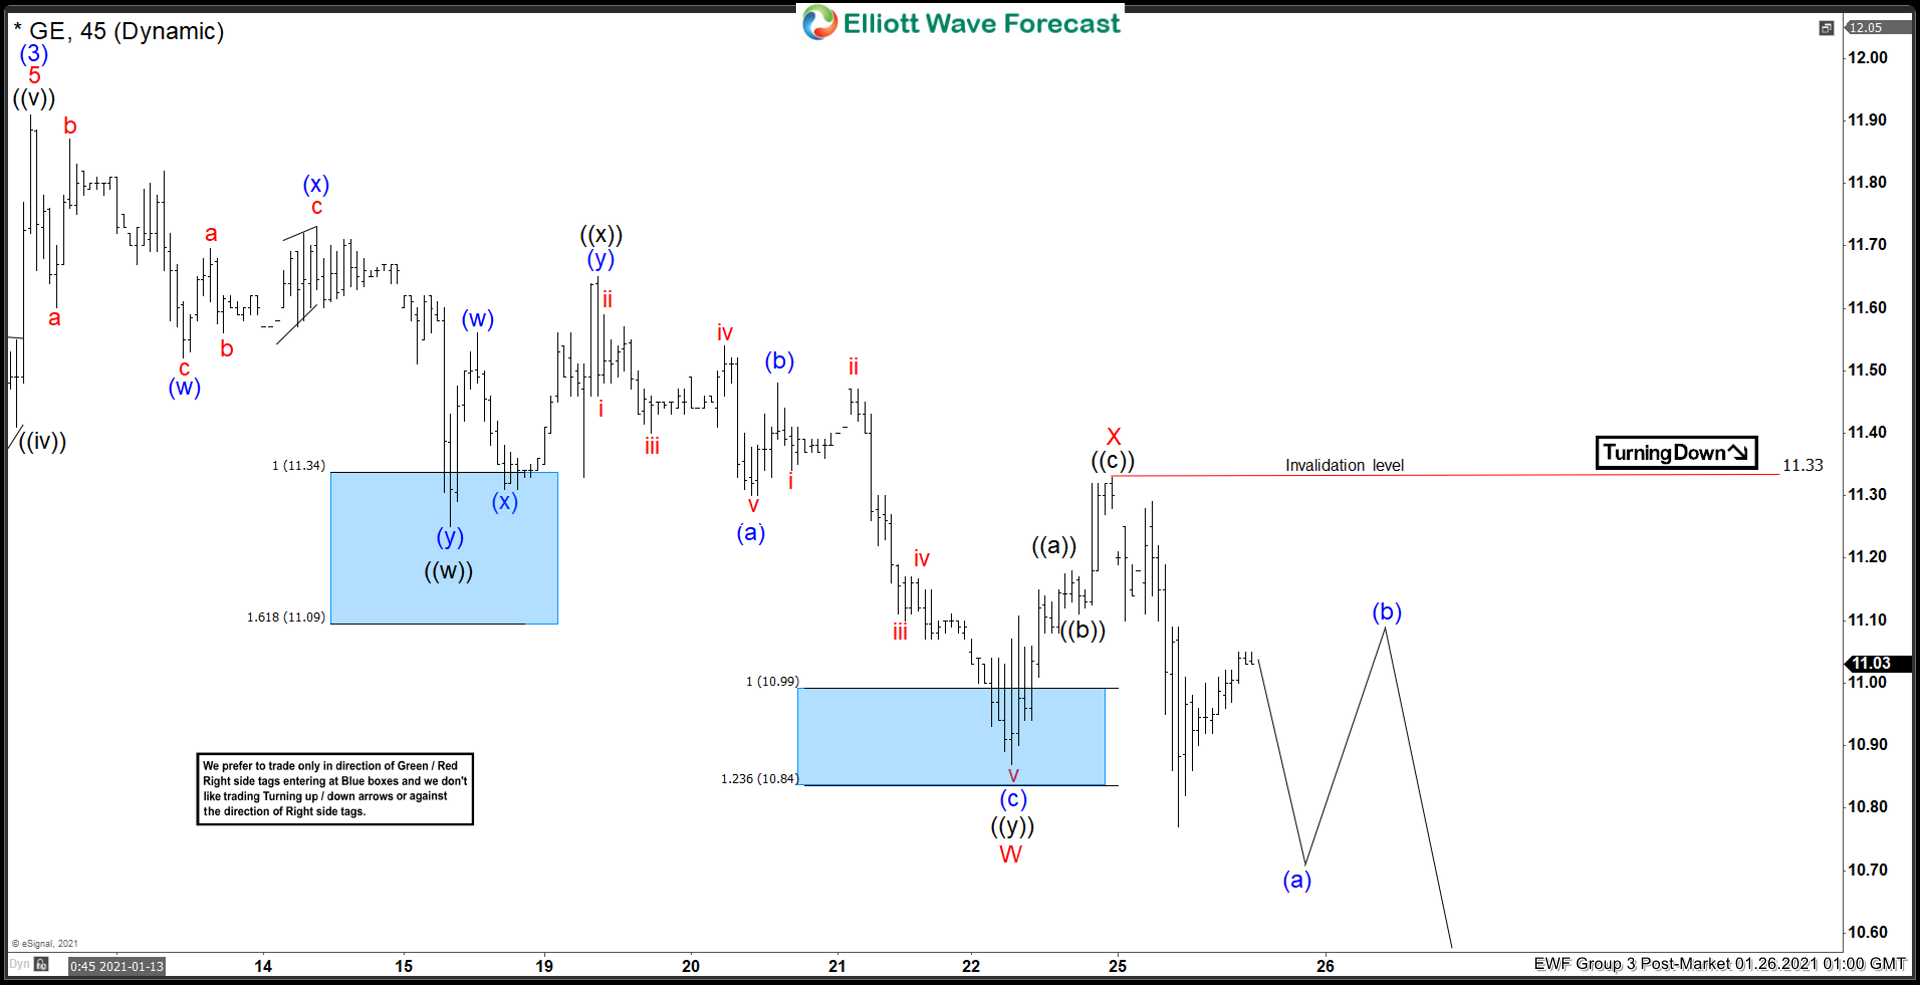
Elliott Wave View: General Electric (GE) Has Further Downside in Correction
Read MoreGeneral Electric (GE) shows incomplete sequence from January 13 peak & the stock can see more downside. This article & video look at the Elliott Wave path.
-
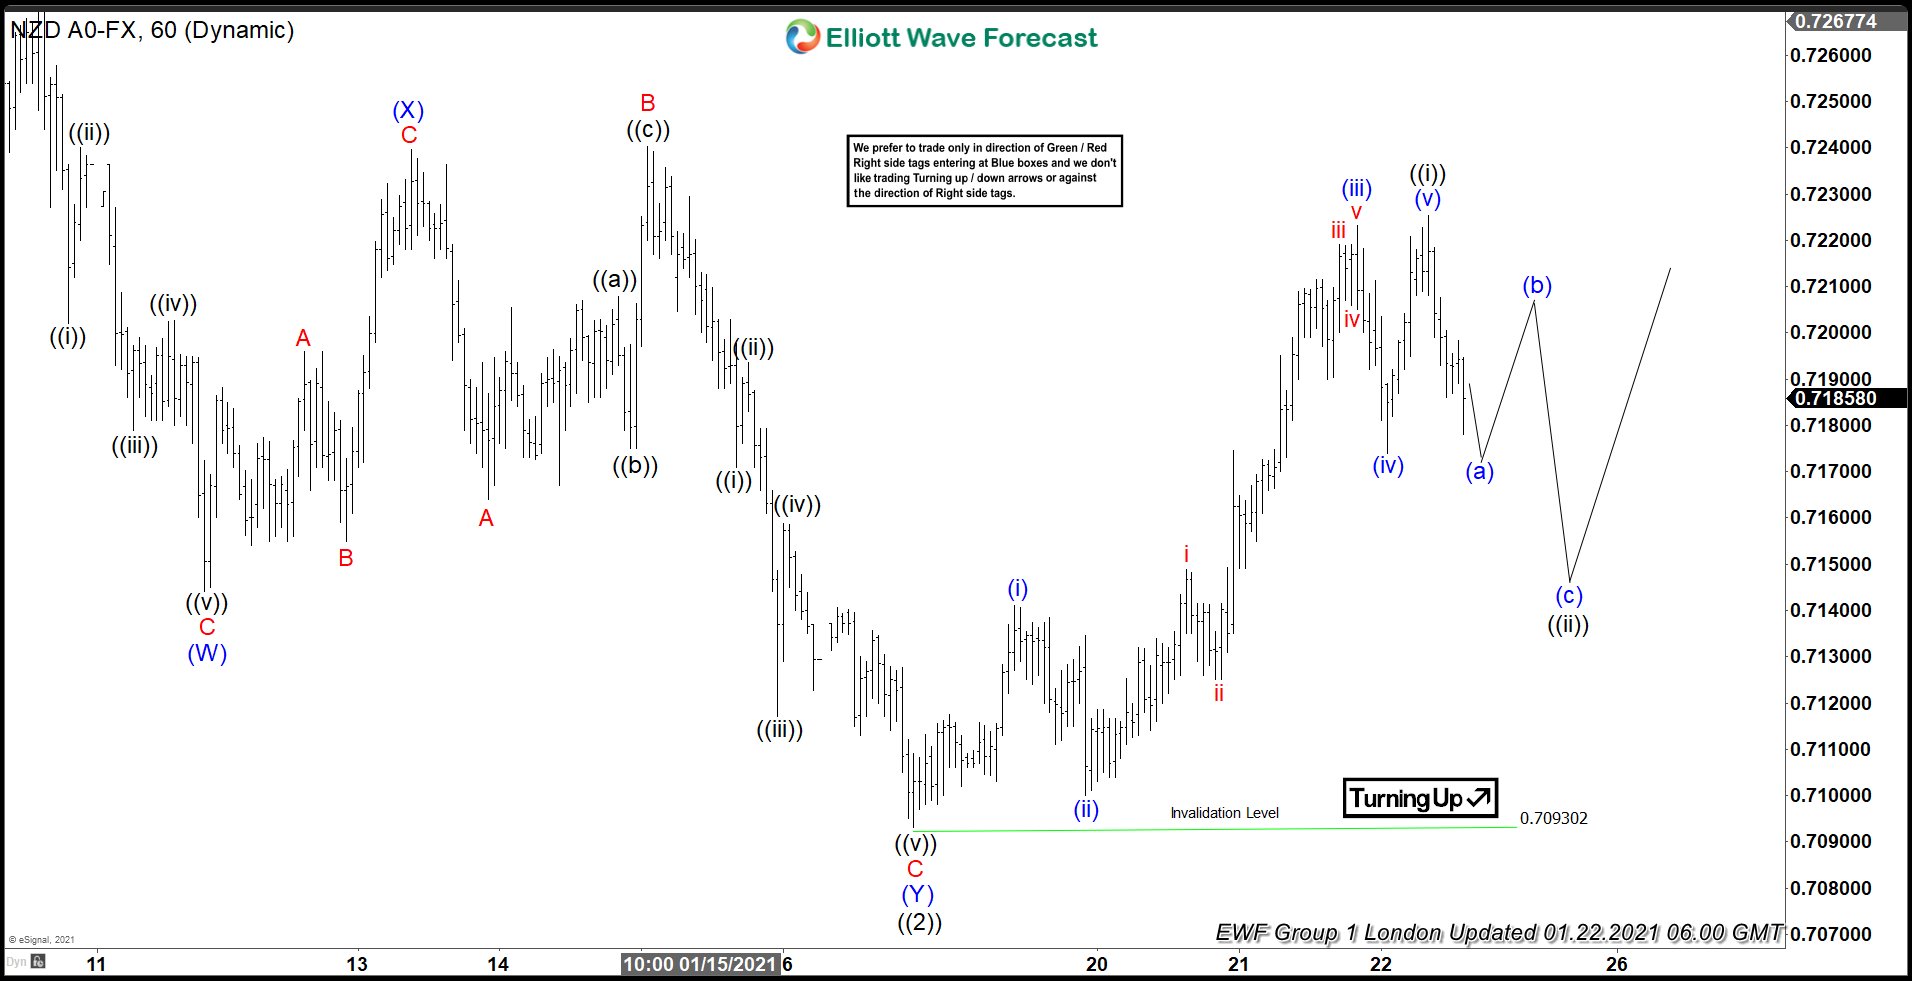
Elliott Wave View: Impulsive Rally in NZDUSD
Read MoreNZDUSD rally from January 18 low looks impulsive and pair can see further upside while dips stay above there. This blog looks at Elliott Wave path.
-
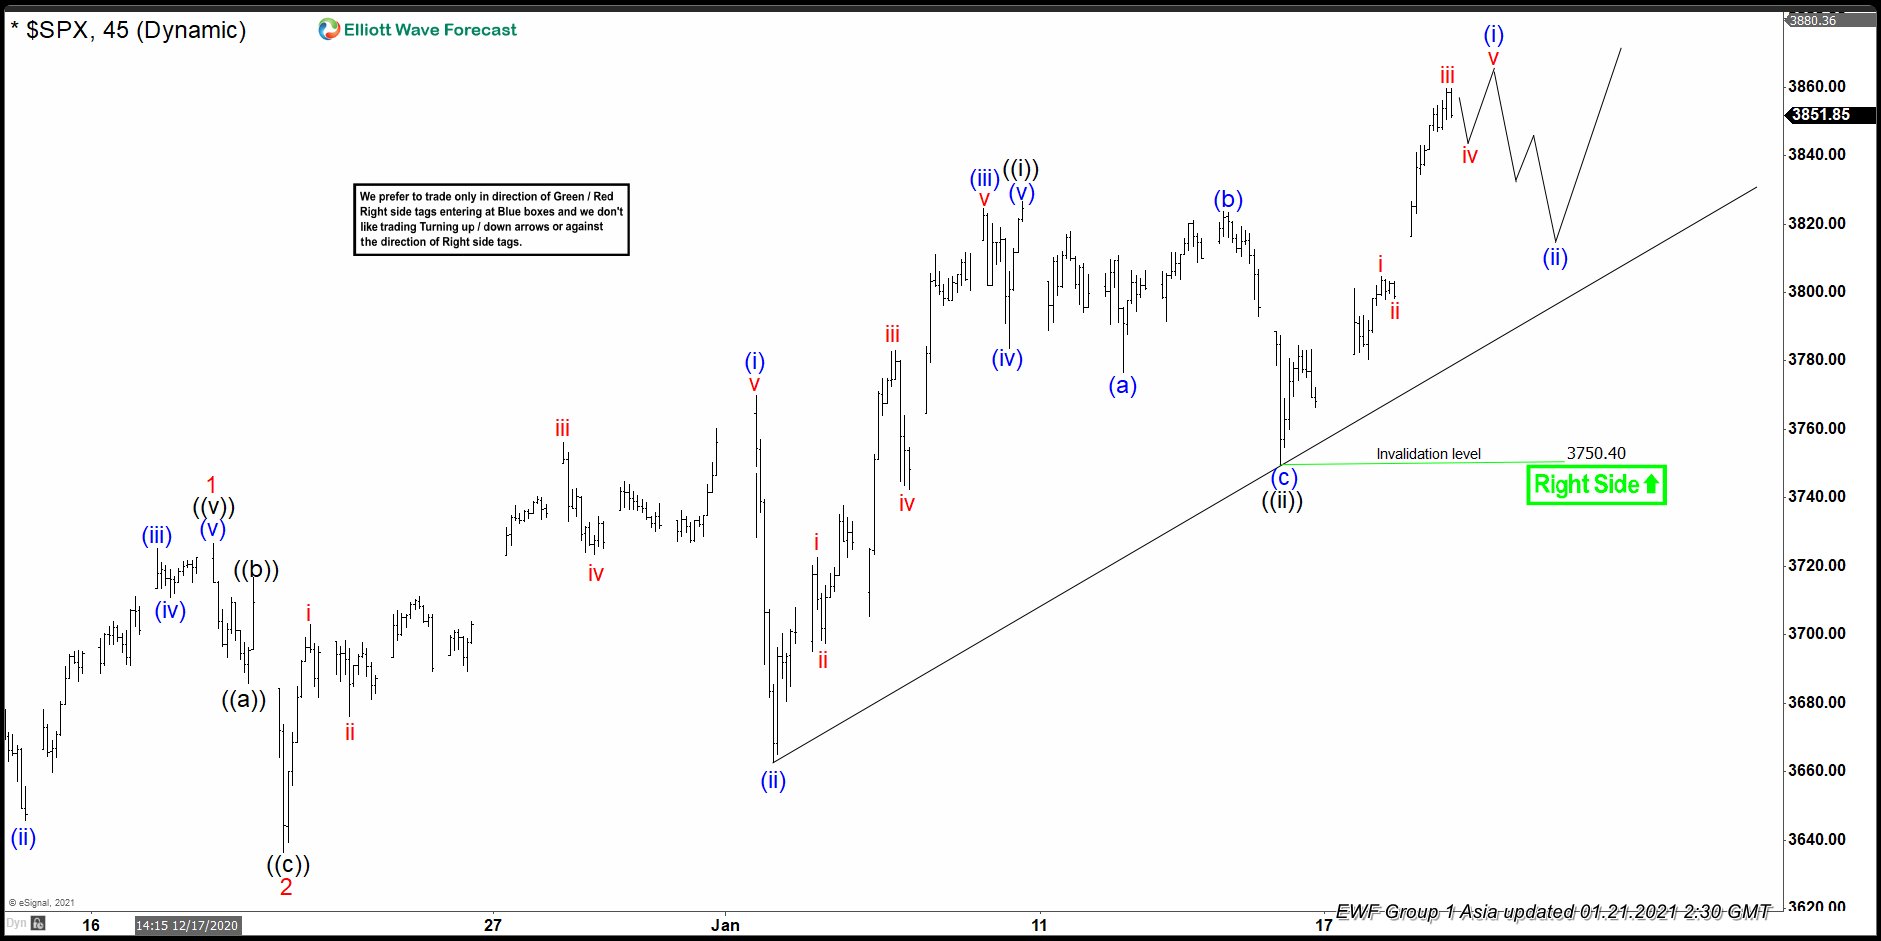
Elliottwave View: SPX Upside Move Has Resumed
Read MoreS&P 500 (SPX) extends to new all-time high and more upside is favored. This article and video look at the Elliott Wave path.
-
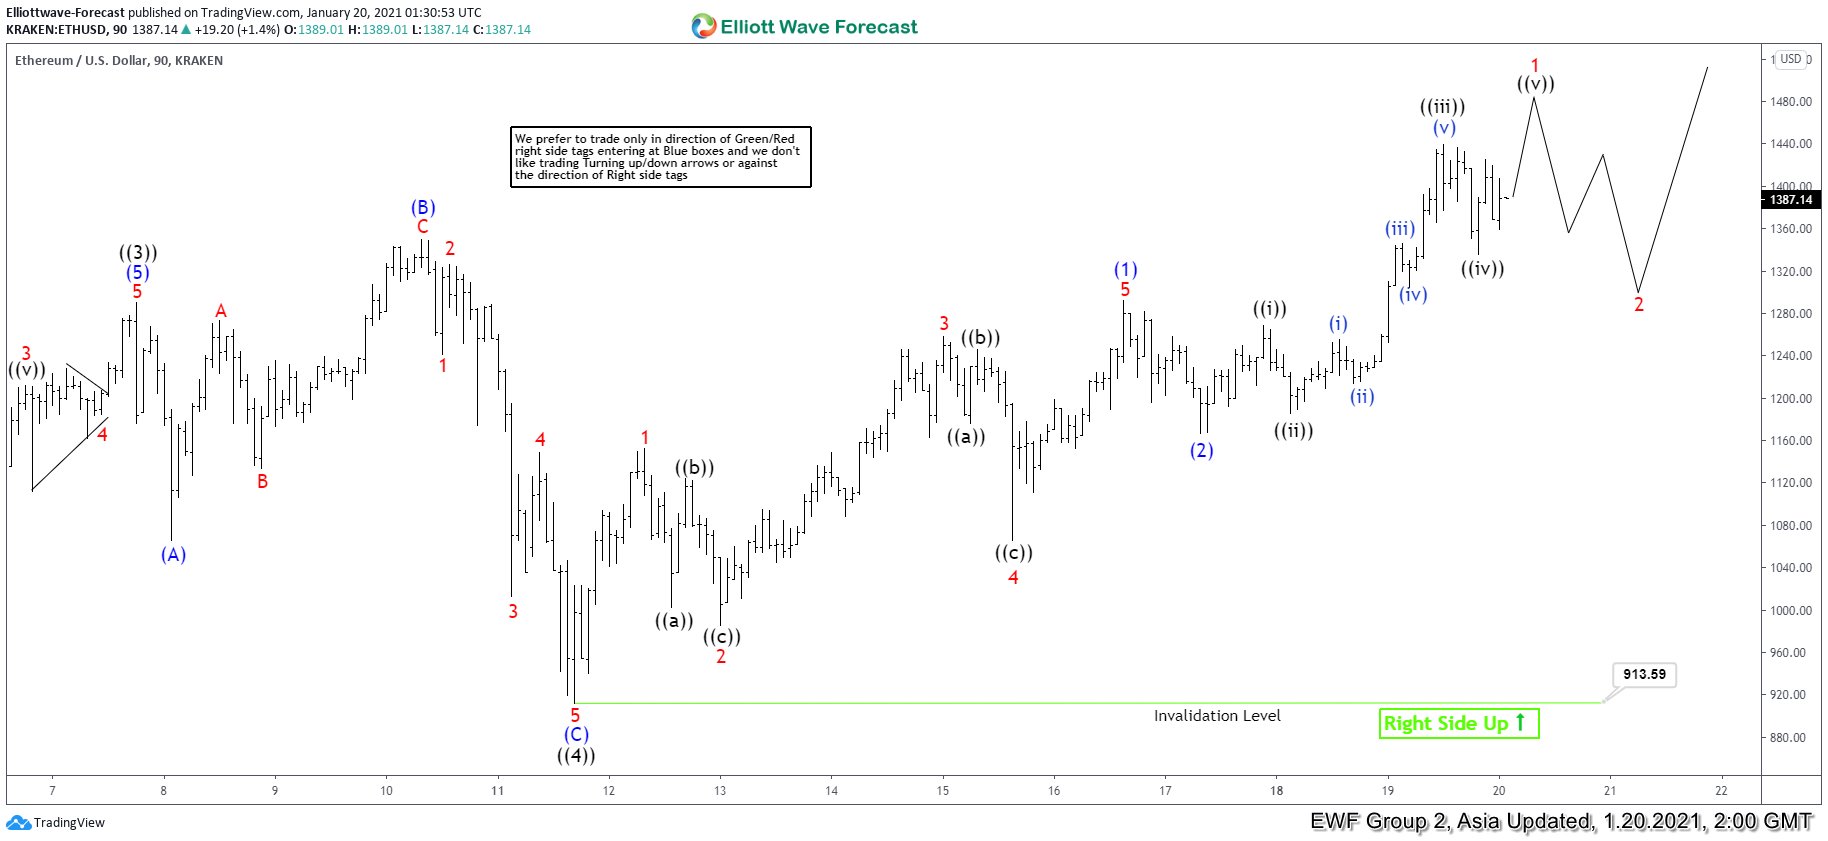
Elliott Wave View: Ethereum Has Resumed Higher in Wave 5
Read MoreEthereum has made a new high since bottoming in March 2020. The crypto currency can see further upside. This article & video look at the Elliott Wave path.
-
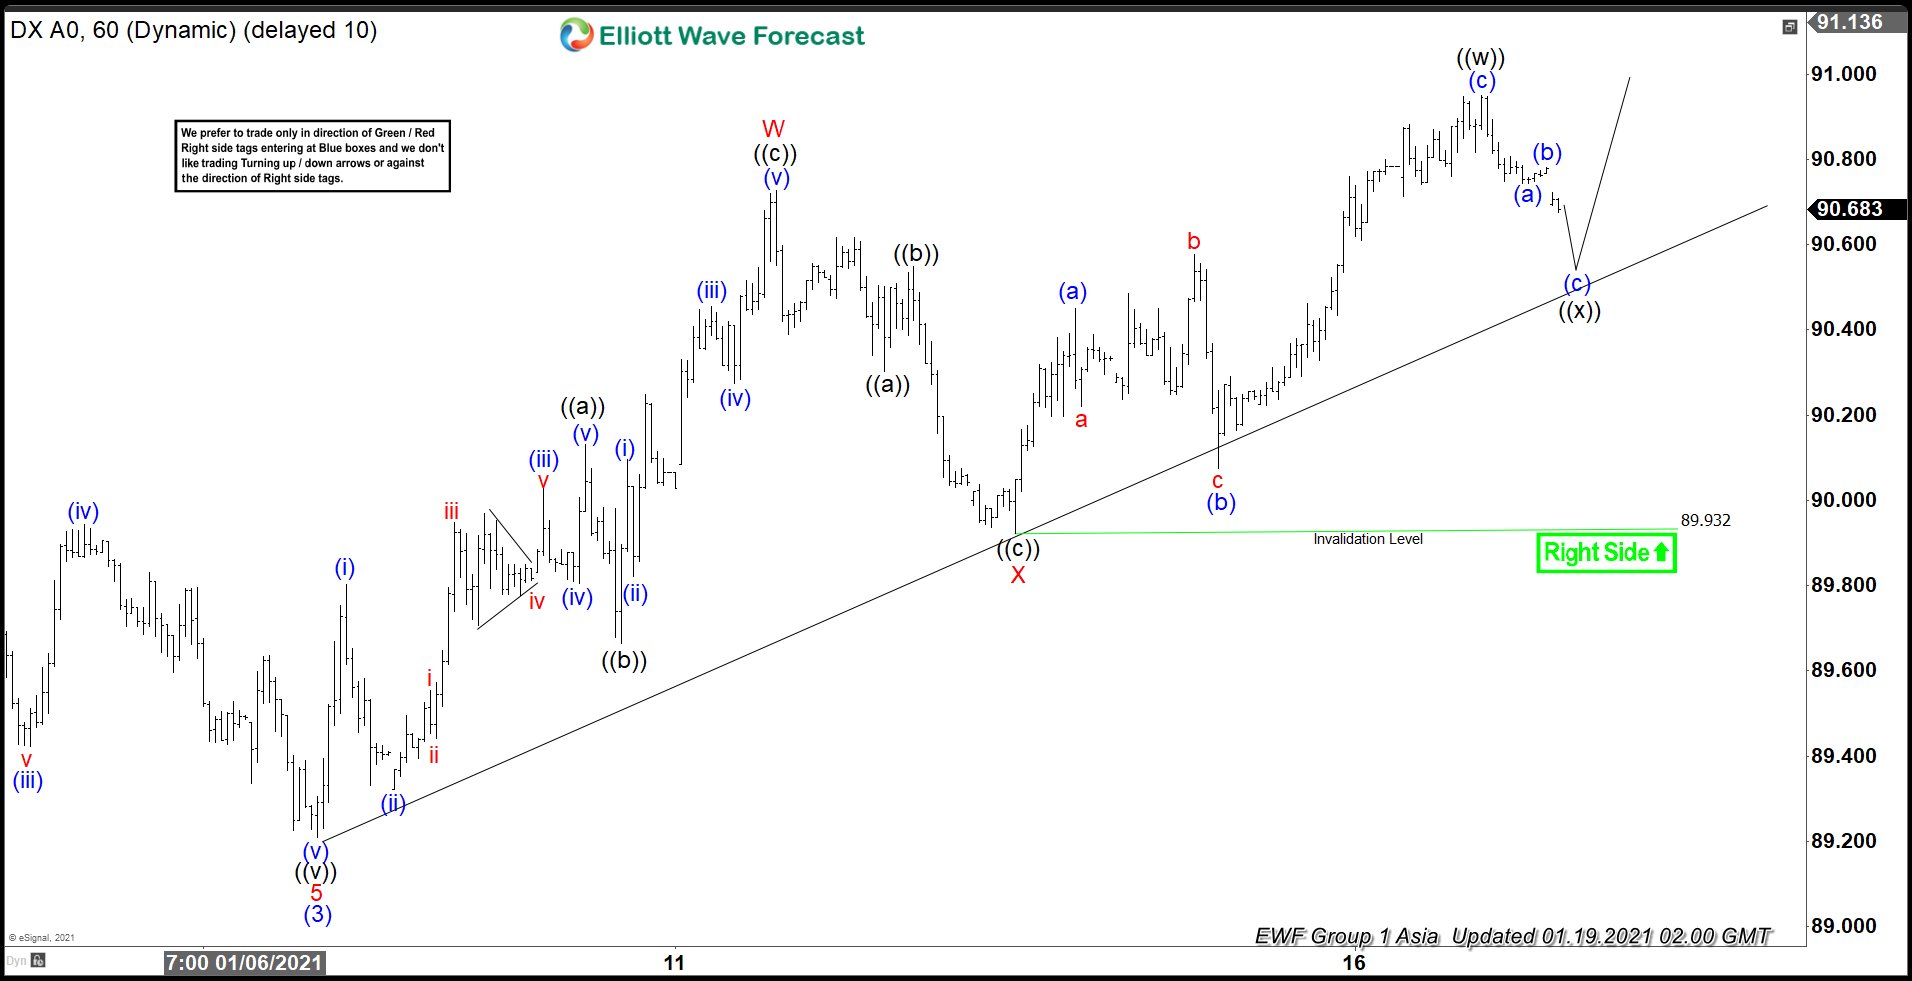
Elliott Wave View: Dollar Index Correction In Progress
Read MoreDollar Index (DXY) cycle from January 6 low remains in progress as a double three. This article and video looks at the Elliott Wave path.
-
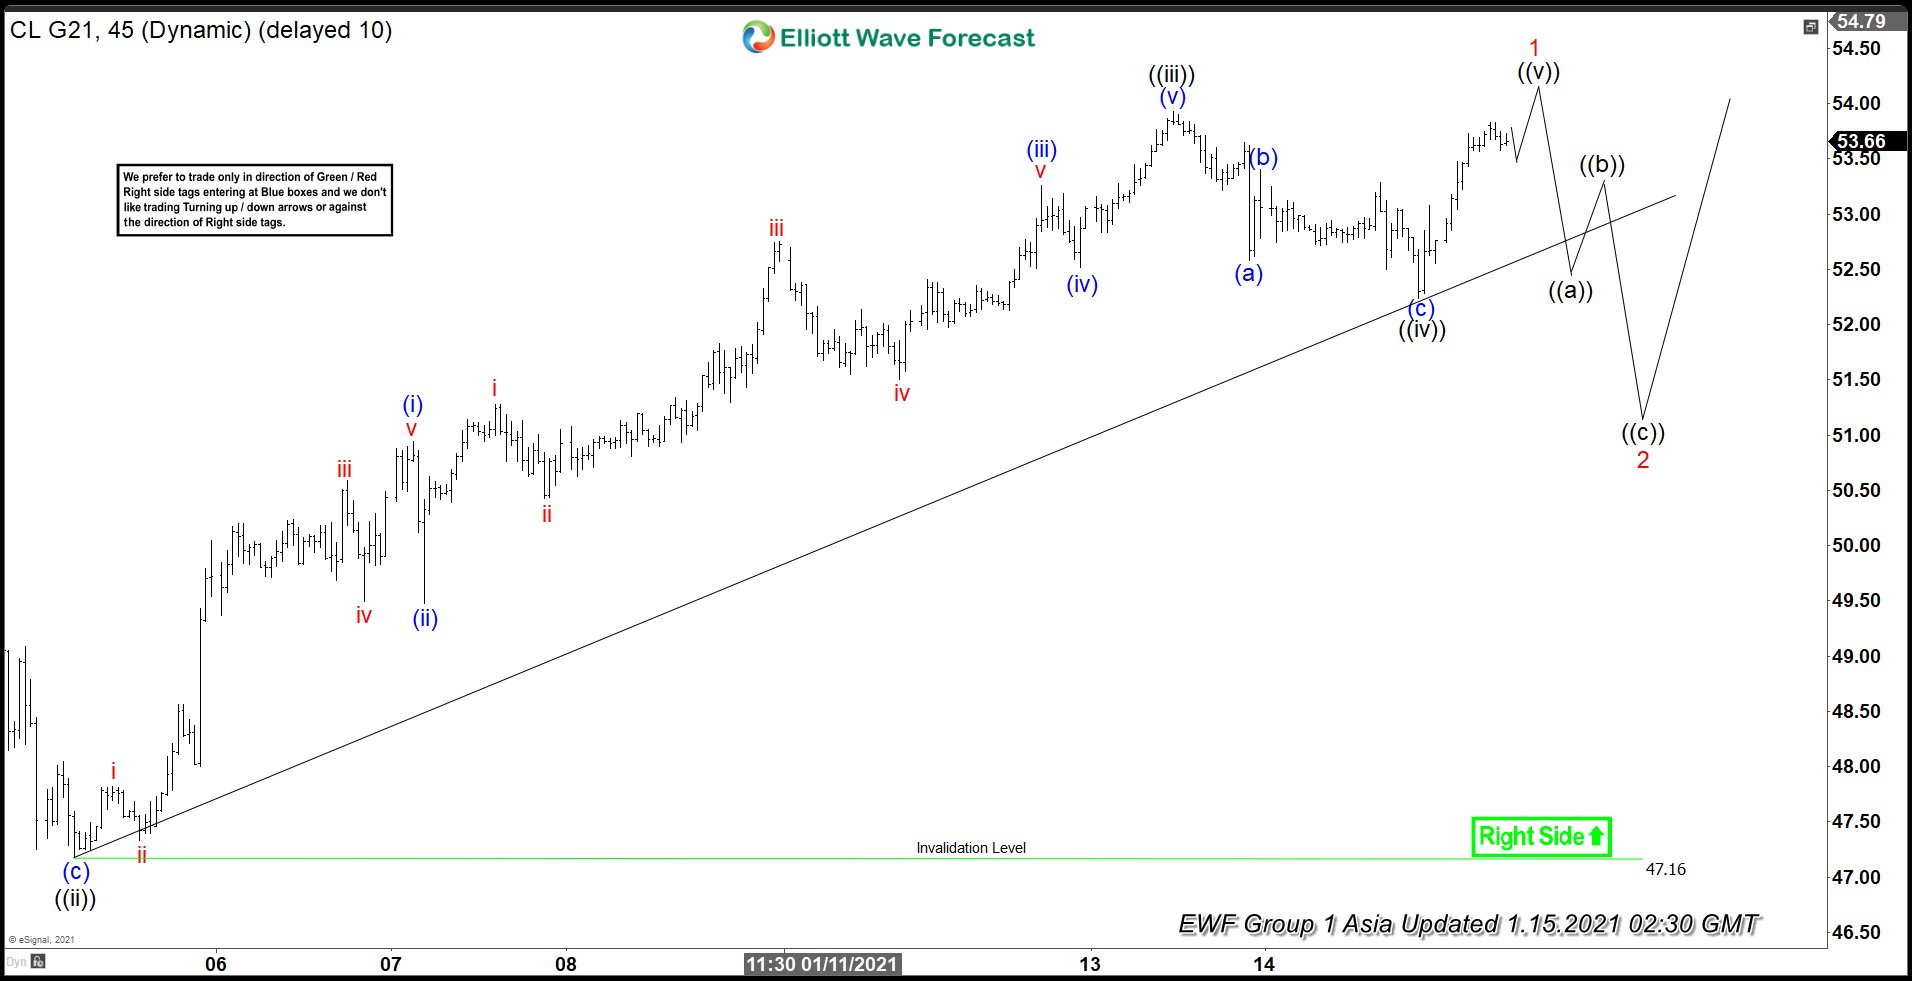
Elliott Wave View: Oil About to End Short Term 5 Waves Impulse
Read MoreCycle from December 23 low is about to end as a 5 waves. Oil may see a pullback soon in 3, 7, 11 swing but larger degree trend remains bullish.