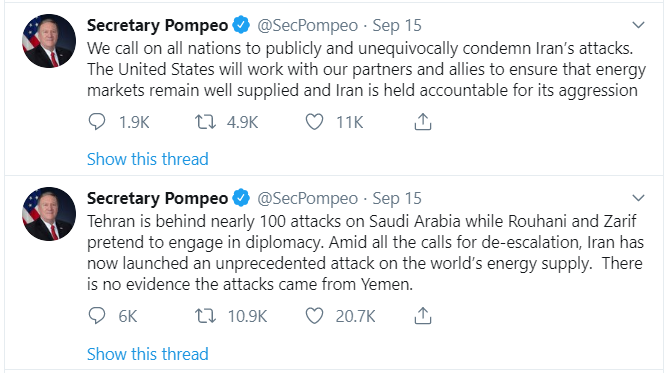
In early Saturday, Saudi Arabia’s oil processing facilities were hit by what initially thought to be drone strikes. Yemen’s Houthi rebels claim responsibility for the attack. The Houthi spokesperson claimed they deployed 10 drones for the attack. However, U.S. Secretary of State Mike Pompeo dismissed the claim and accused Iran instead.
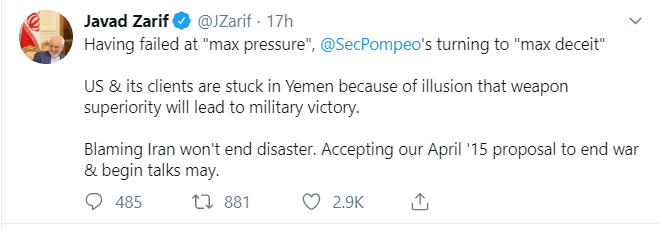
Iran denied the accusation that it was responsible for the attacks. Iranian officials also warned that US military assets in the region are at risk as they are within the range of its missiles. Iranian foreign minister Javad Zarif tweeted a response to U.S accusation
According to Saudi Aramco, the attack will impact 5.7 million barrels of crude oil production in a day. This represents more than 50% of Saudi Arabia’s daily output of 9.85 million barrels per day and also 5% of the world’s oil demand. This latest attack came as Saudi Arabia prepares for the initial public offering of Saudi Aramco.
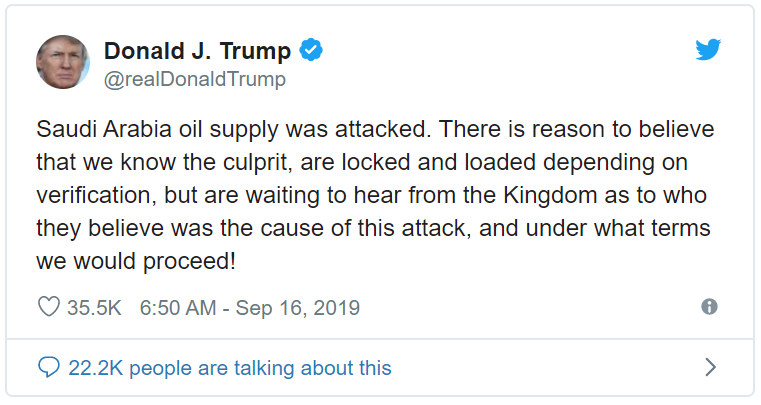
President Trump on Sunday evening tweeted that the U.S knows who is behind it. He further said the U.S. is locked and loaded, ready to respond after confirmation from the Saudi Arabia. The tweet perhaps is the clearest hint by the president for the potential American military response.
The escalation came as tension between Tehran and the U.S. start to ease recently and Security Advisor John Bolton got fired. Trump later tweeted that it is incorrect to say that he is willing to meet with Iran with no condition. Military officials argue that the angle of the attack on the northwest suggests it’s unlikely that the attack came from Yemen. Officials suggest that the attack most likely originated in Iran or Iraq.
Oil prices soared more than 17% in the wake of the attack and reached six-month highs. Below we will take a look at the Elliott Wave technical outlook.
Oil (CL_F) Daily Elliott Wave Outlook First Scenario
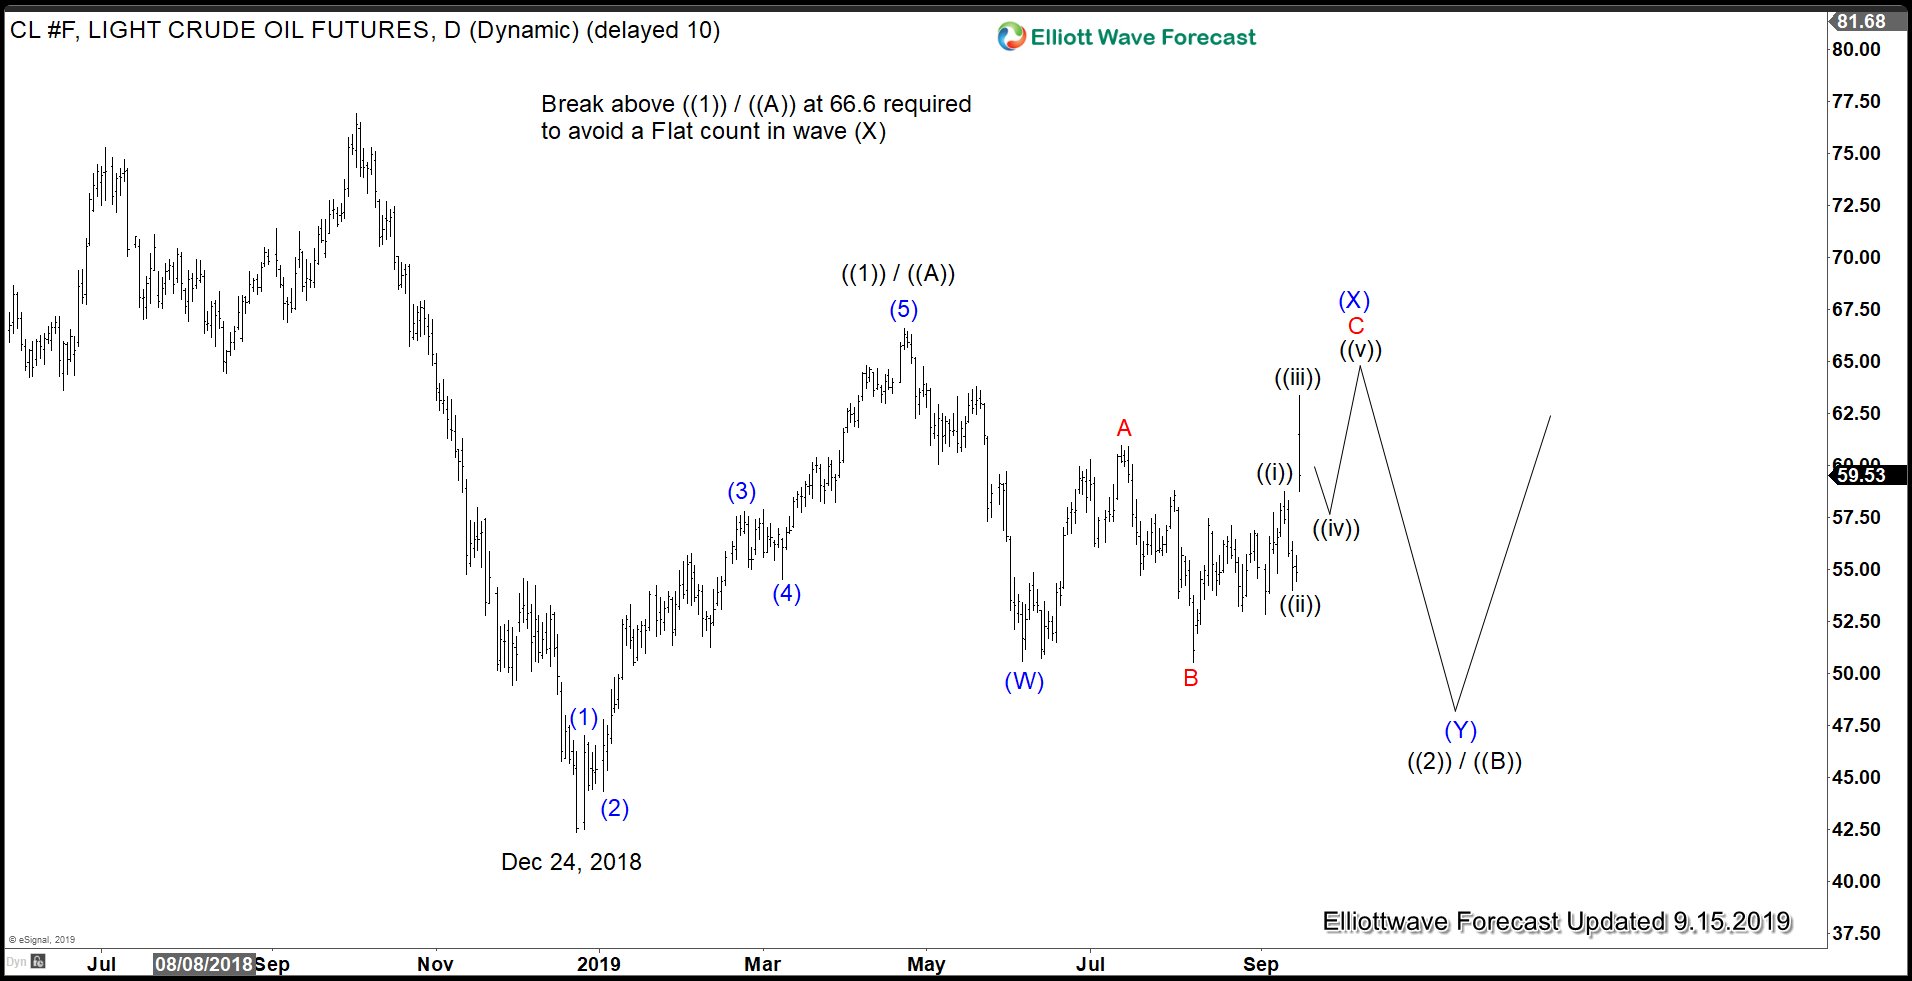
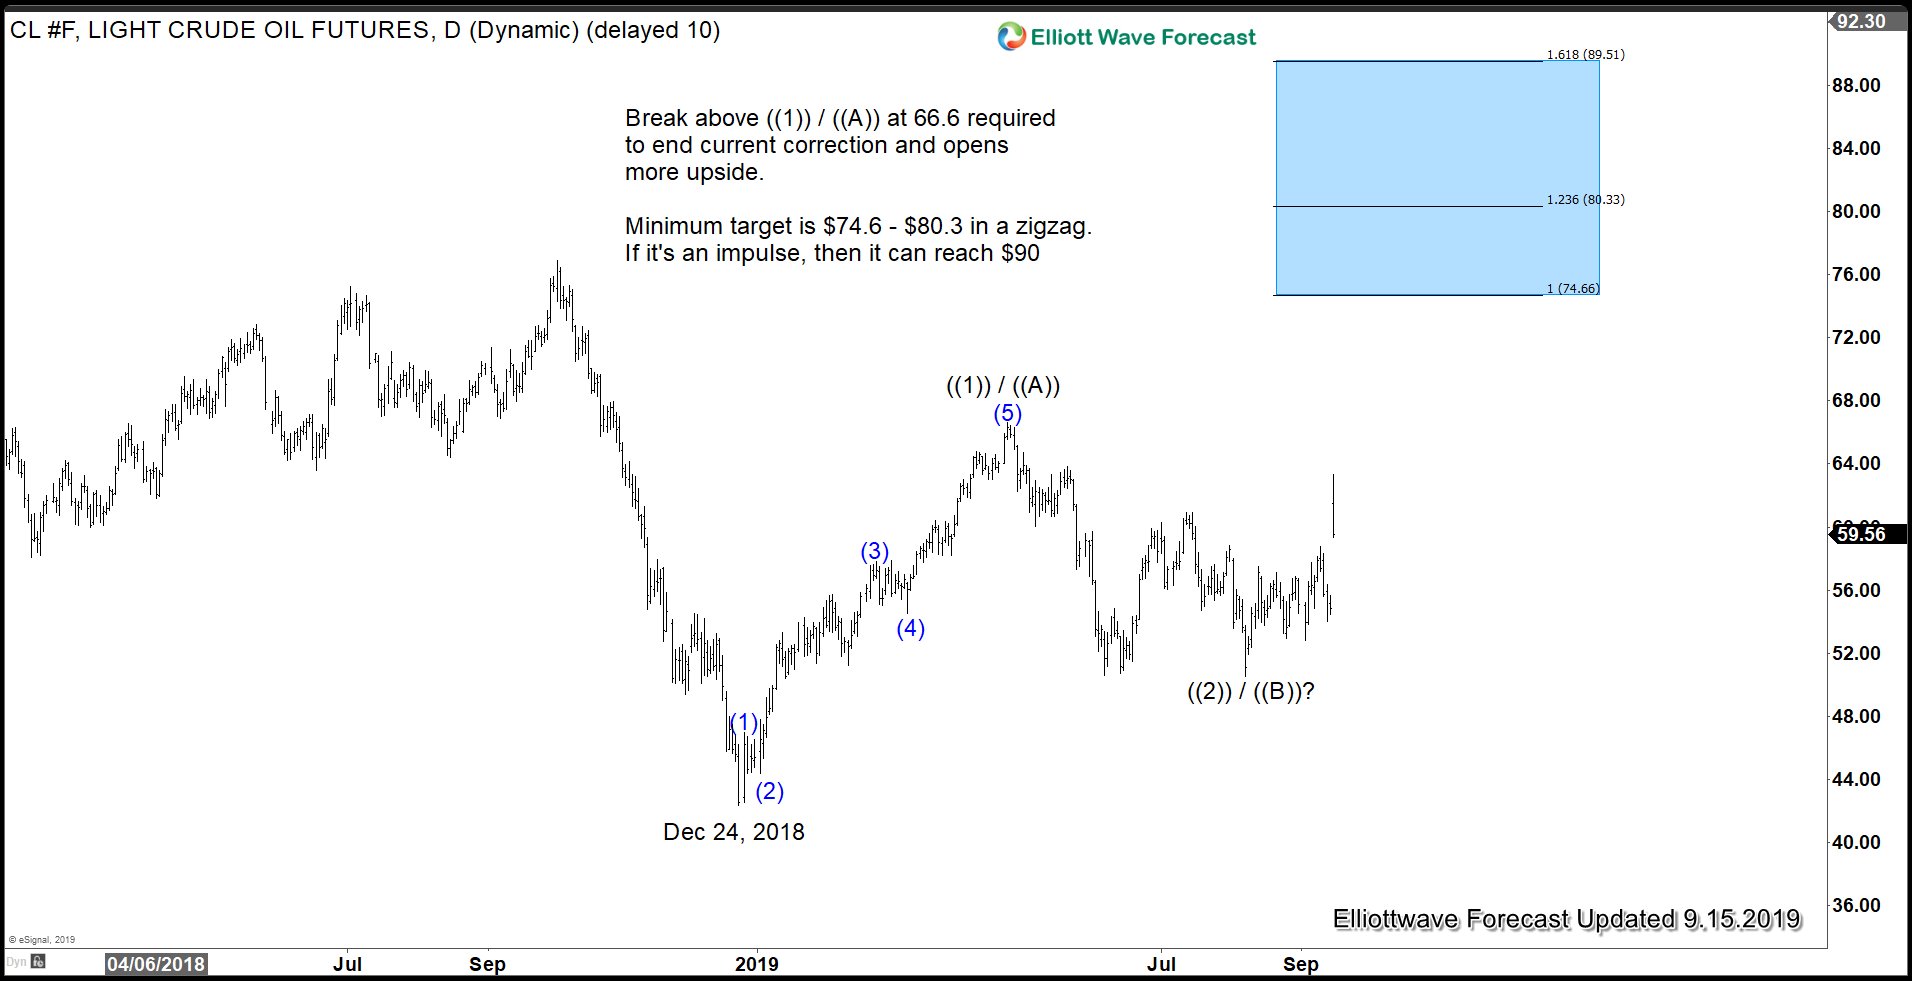
The rally in CL_F from December 24, 2018 low to $66.6 ended wave ((1)) or ((A)). The subdivision unfolded as a 5 waves impulse Elliott Wave structure. Despite the big upside gap on Monday, CL_F still needs to break above wave ((1)) / ((A)) at $66.6 on April 23 high. Otherwise, a Flat correction as per above chart still can’t be ruled out and Oil can still turn lower again to retest December 24, 2018 low. Although Saudi Arabia lost significant production output from the attack, latest report suggests they perhaps can restore majority of the lost output by next Monday. In addition, President Trump has authorized the release of oil from Strategic Petroleum Reserve to ensure supply of Oil will not face significant disruption.
Oil (CL_F) Daily Elliott Wave Outlook Second Scenario
The second scenario above assumes Oil is able to break above wave ((1)) / ((A)) at $66.6 in coming days / weeks,. This suggests wave ((2)) / ((B)) has ended at $50.52 and Oil can resume higher again. Assuming $66.6 breaks, then a conservative zigzag target suggests Oil can see $74.6 – $80.3. If the rally is impulsive, then Oil can see as high as $90, which is 161.8% Fibonacci extension of wave ((1)).
To get the latest update in Oil or other commodities, forex, and stock market, take our 14 days Free Trial and check our service. Get your trial here –> 14 days FREE trial.
Back
