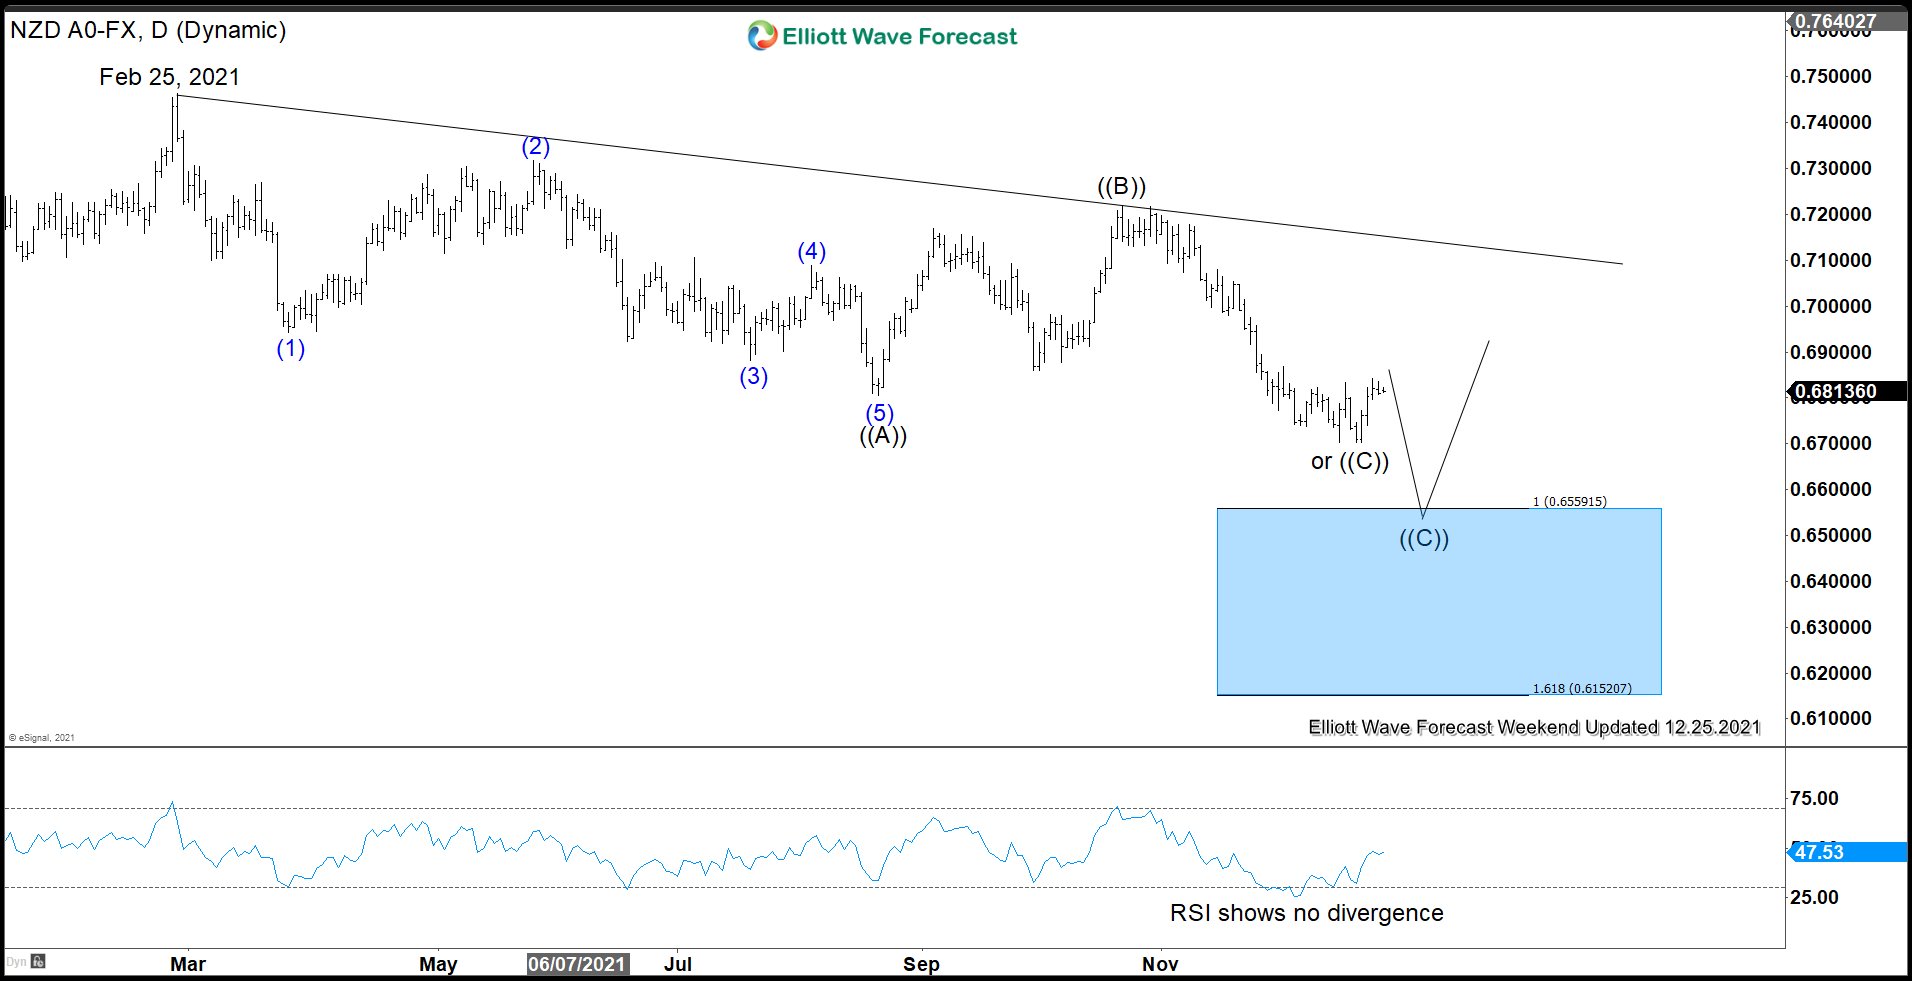
NZDUSD shows incomplete lower low sequence from February 25, 2021 peak favoring more downside. Below is the daily chart of NZDUSD showing the incomplete bearish sequence
NZDUSD Daily Elliott Wave Chart
The Daily Chart of NZDUSD above shows a possible 100% – 161.8% Fibonacci extension target from February 25, 2021 peak towards 0.615 – 0.656. The short term rally is expected to fail in the sequence of 3, 7, or 11 swing for further downside as the primary view. The alternate view suggests a truncated zigzag from February 25, 2021 high. The truncated view is also a possibility although it’s not the primary view. The current RSI shows no momentum divergence suggesting that it’s possible wave ((C)) truncates without reaching the 100%.
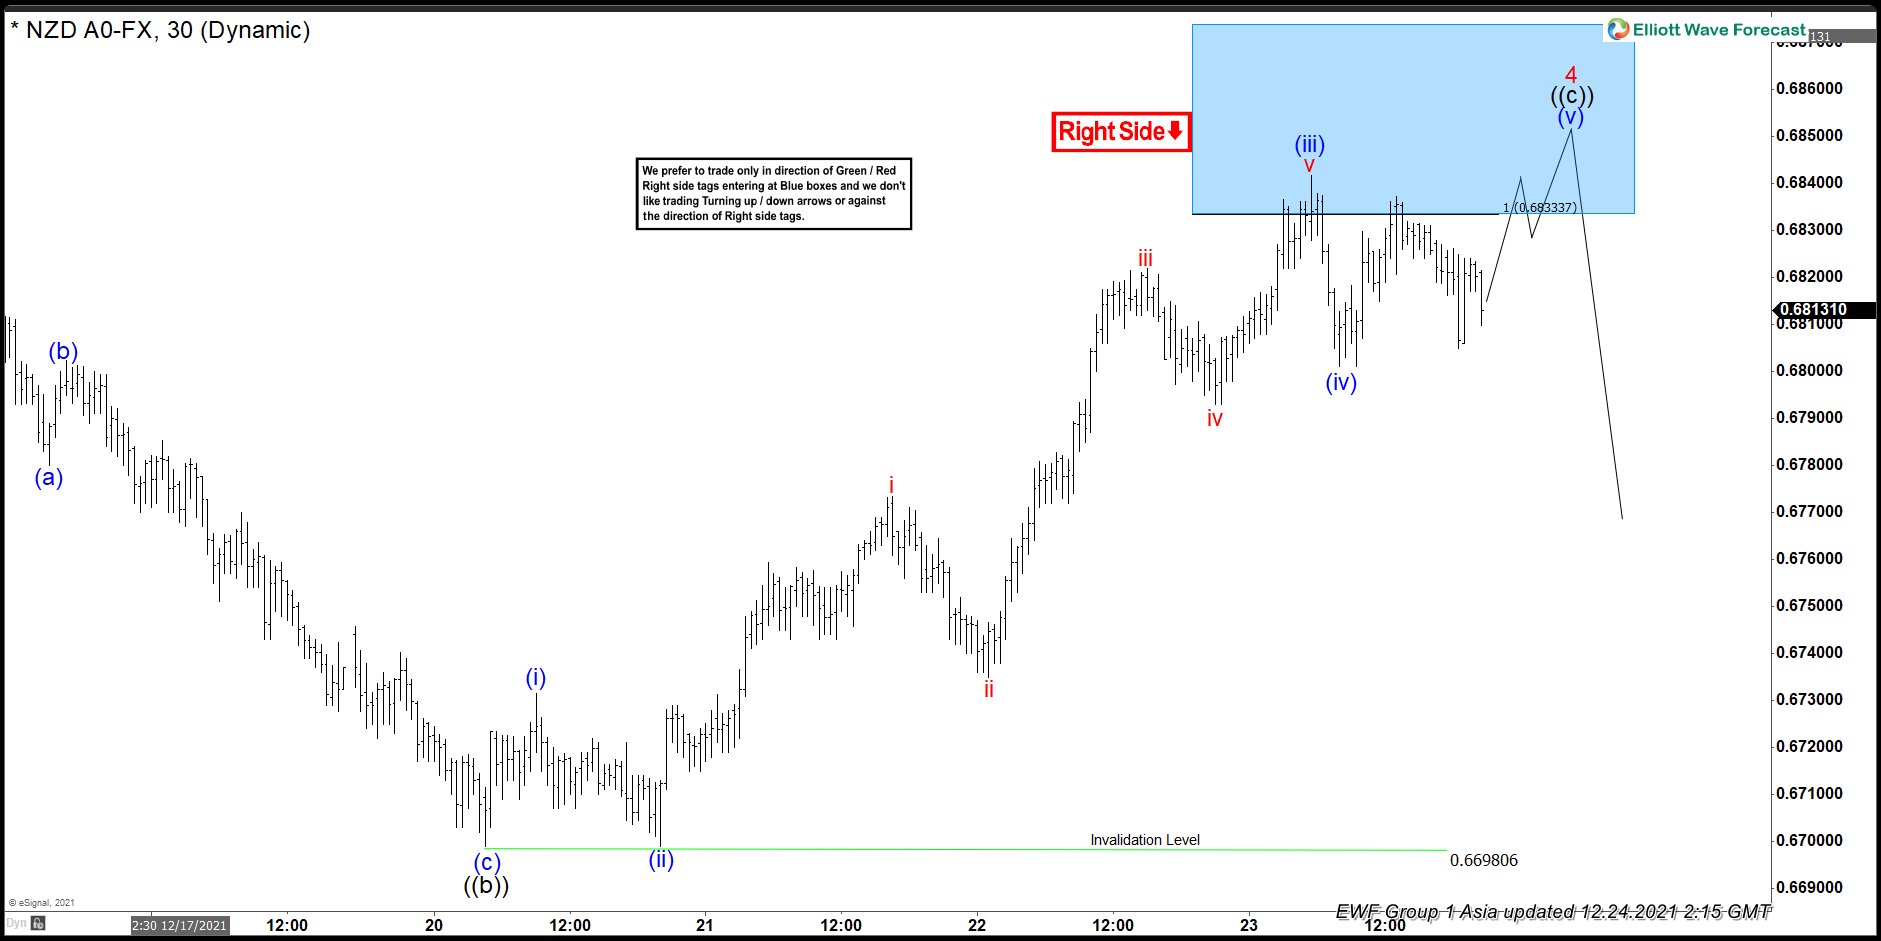
NZDUSD 1 Hour Elliott Wave Chart
The 1 hour chart per 24 December suggests that rally is expected to fail at 0.633 – 0.686 area. This is the 100% – 123.6% Fibonacci extension from December 16, 2021 low. From the blue box area, pair can then either resumes lower or pullback in 3 waves at least. The view is valid as long as it doesn’t extend to 161.8% extension at 0.691. If the rally continues to extend to 0.691, the entire rally can becomes an impulse.
Back


