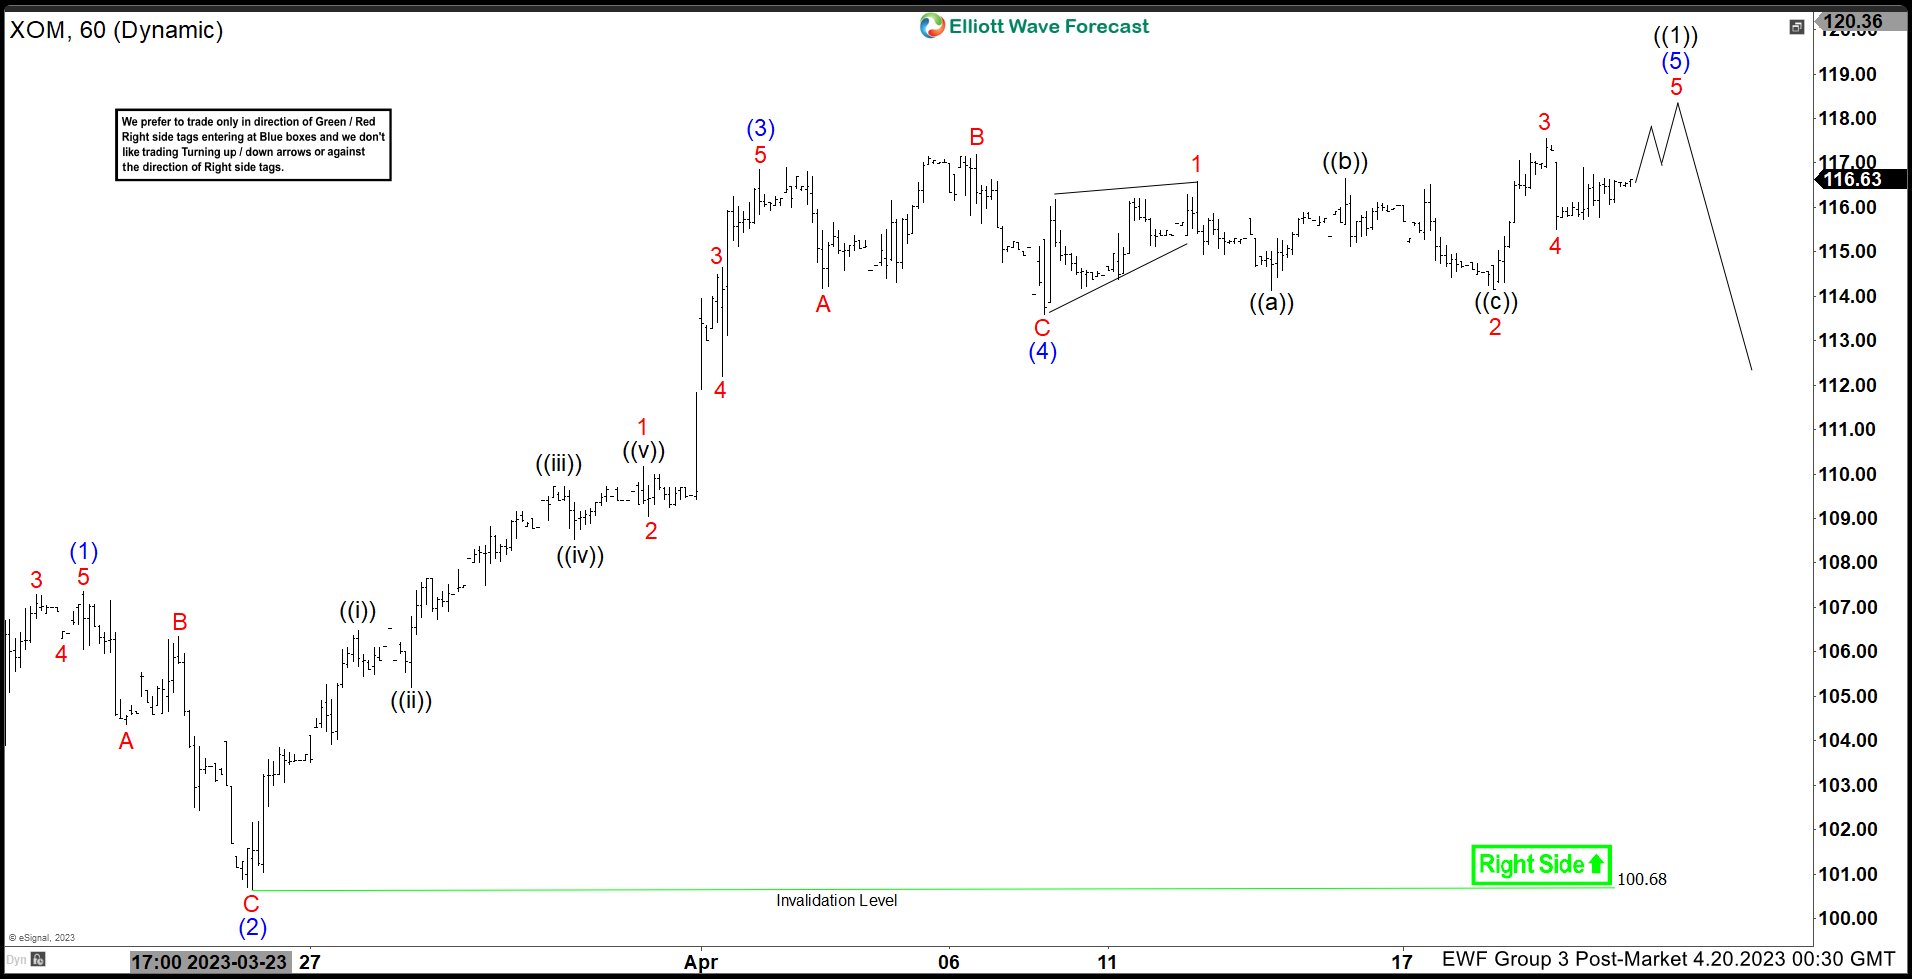
Exxon Mobil (XOM) cycle from 3.20.2023 low is in progress as a 5 waves impulse Elliott Wave structure. Up from 3.20.2023 low, wave (1) ended at 107.35 and pullback in wave 2 ended at 100.68 as the 1 hour chart below shows. Up from there, wave 1 ended at 110.17 and wave 2 ended at 109.05. Wave 3 ended at 114.64, wave 4 ended at 112.20. Final wave 5 ended at 116.85 which completed wave (3) in higher degree.
Wave (4) pullback took the form of a zigzag Elliott Wave structure. Down from wave (3), wave A ended at 114.17, and wave B ended at 117.18. Wave C lower ended at 113.6 which completed wave (4). Wave (5) is in progress as a 5 waves diagonal structure. Up from wave (4), wave 1 ended at 116.59 and pullback in wave 2 ended at 114.16. Wave 3 ended at 117.56 and dips in wave 4 ended at 115.50. Near term, expect XOM to extend higher to complete wave 5 of (5) of ((1)) before cycle from 3.20.2023 low ends and the stock see a larger degree pullback. As far as pivot at 100.68 low stays intact, expect the stock to extend the final leg higher before ending cycle from 3.20.2023 low.


