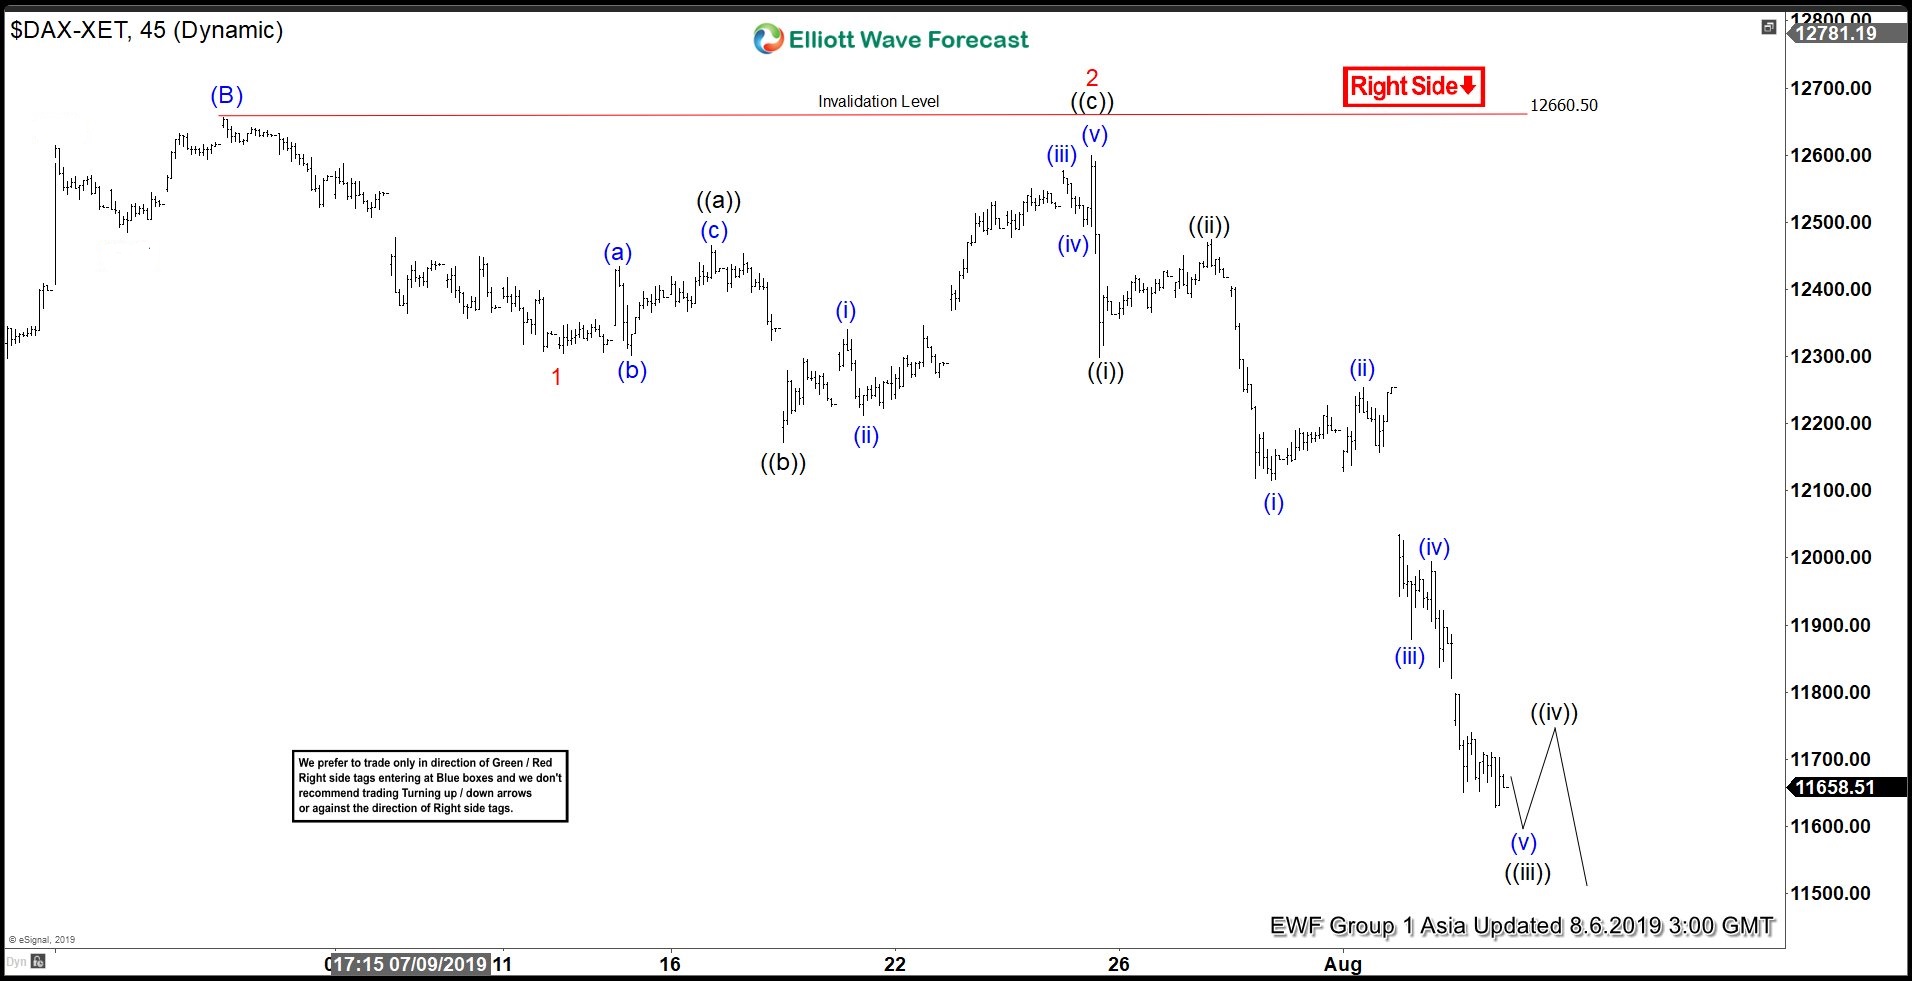
Elliott Wave view suggests the bounce to 12660.50 in DAX ended wave (B). The rally to 12660.50 is part of an Expanded Flat structure which starts from May 3, 2019 high. Wave (C) decline is now in progress and unfolding as an impulse Elliott Wave structure. This decline is correcting the cycle from December 27, 2018 low and while pivot on December 27, 2018 low (10279.20) stays intact, expect Index to later resume higher again.
Near term, down from 12660.50 high, wave 1 ended at 12304.98 and wave 2 ended at 12599.93. Wave 3 is in progress and subdivides as an impulse of lesser degree. Wave ((i)) of 3 ended at 12299.1 and wave ((ii)) of 3 ended at 12473.97. Short term cycle is mature and wave ((iii)) has enough number of swing to end. Expect the Index to bounce in wave ((iv)) soon in 3, 7, or 11 swing to correct cycle from July 29 high before the decline resumes. We don’t like buying the Index. Near term, expect further downside in DAX to complete wave (C) lower as far as pivot at 12660.5 stays intact. Potential target to the downside is 50-76.4% Fibonacci retracement from December 27, 2018 low at 10839 – 11462.
DAX 1 Hour Elliott Wave Chart


