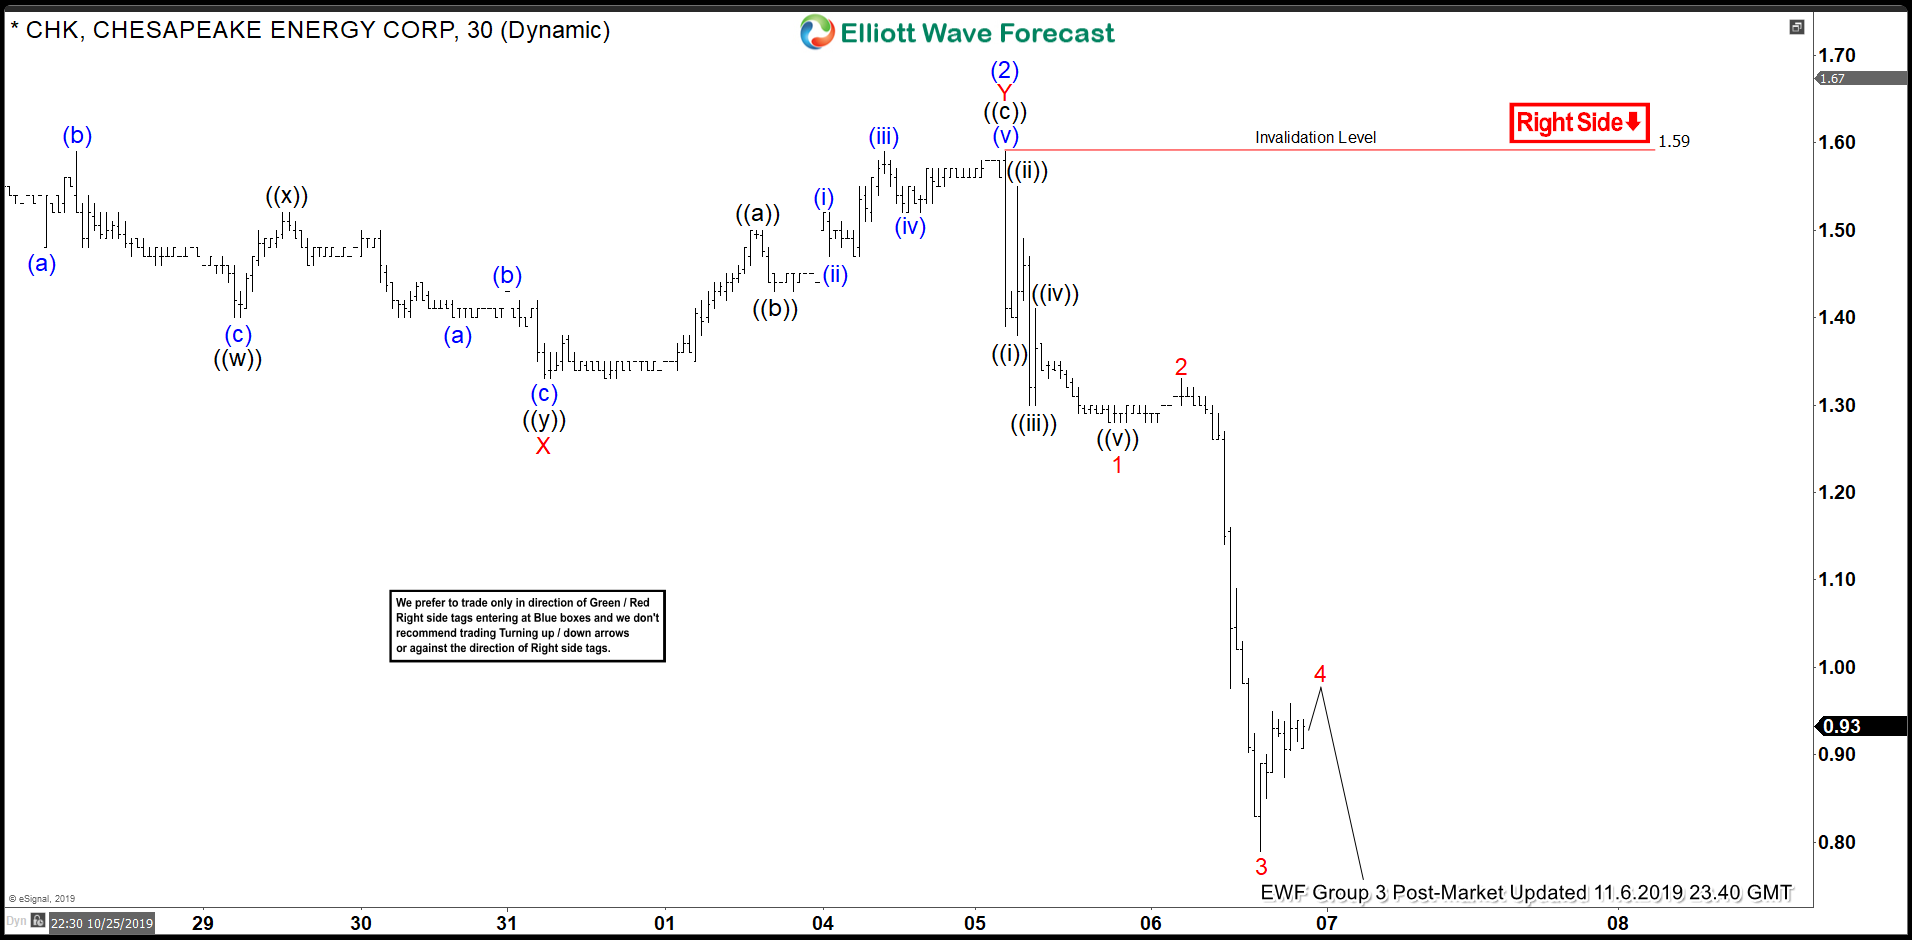
Short Term Elliott Wave View on Chesapeake Energy Corp (ticker: CHK) shows 5 waves impulsive Elliott Wave decline from November 5 high. The bounce to $1.59 in the stock ended wave (2) as a double three Elliott Wave structure. On the chart below, we can see wave X of this double three ended at $1.33 and wave Y ended at $1.59. Down from 1.59, the decline has resumed with wave 1 ended at $1.28 as a 5 waves impulse in lesser degree. Bounce to wave 2 ended at $1.33. The stock then extended lower in wave 3 towards $0.79. Wave 3 is extended at 161.8% Fibonacci extension of wave 1. This extension further supports the idea the decline is only wave 3 and therefore likely not done.
Wave 4 bounce is currently in progress to correct the decline from wave 2. As far as the rally fails below 1.59, expect more downside in the stock. Wave 4 likely can complete at 23.6 – 38.2% retracement of wave 3 which comes at 0.99 – 1.06. Potential target to the downside is 100% Fibonacci extension from September 16 high which comes at 0.45 – 0.67.


