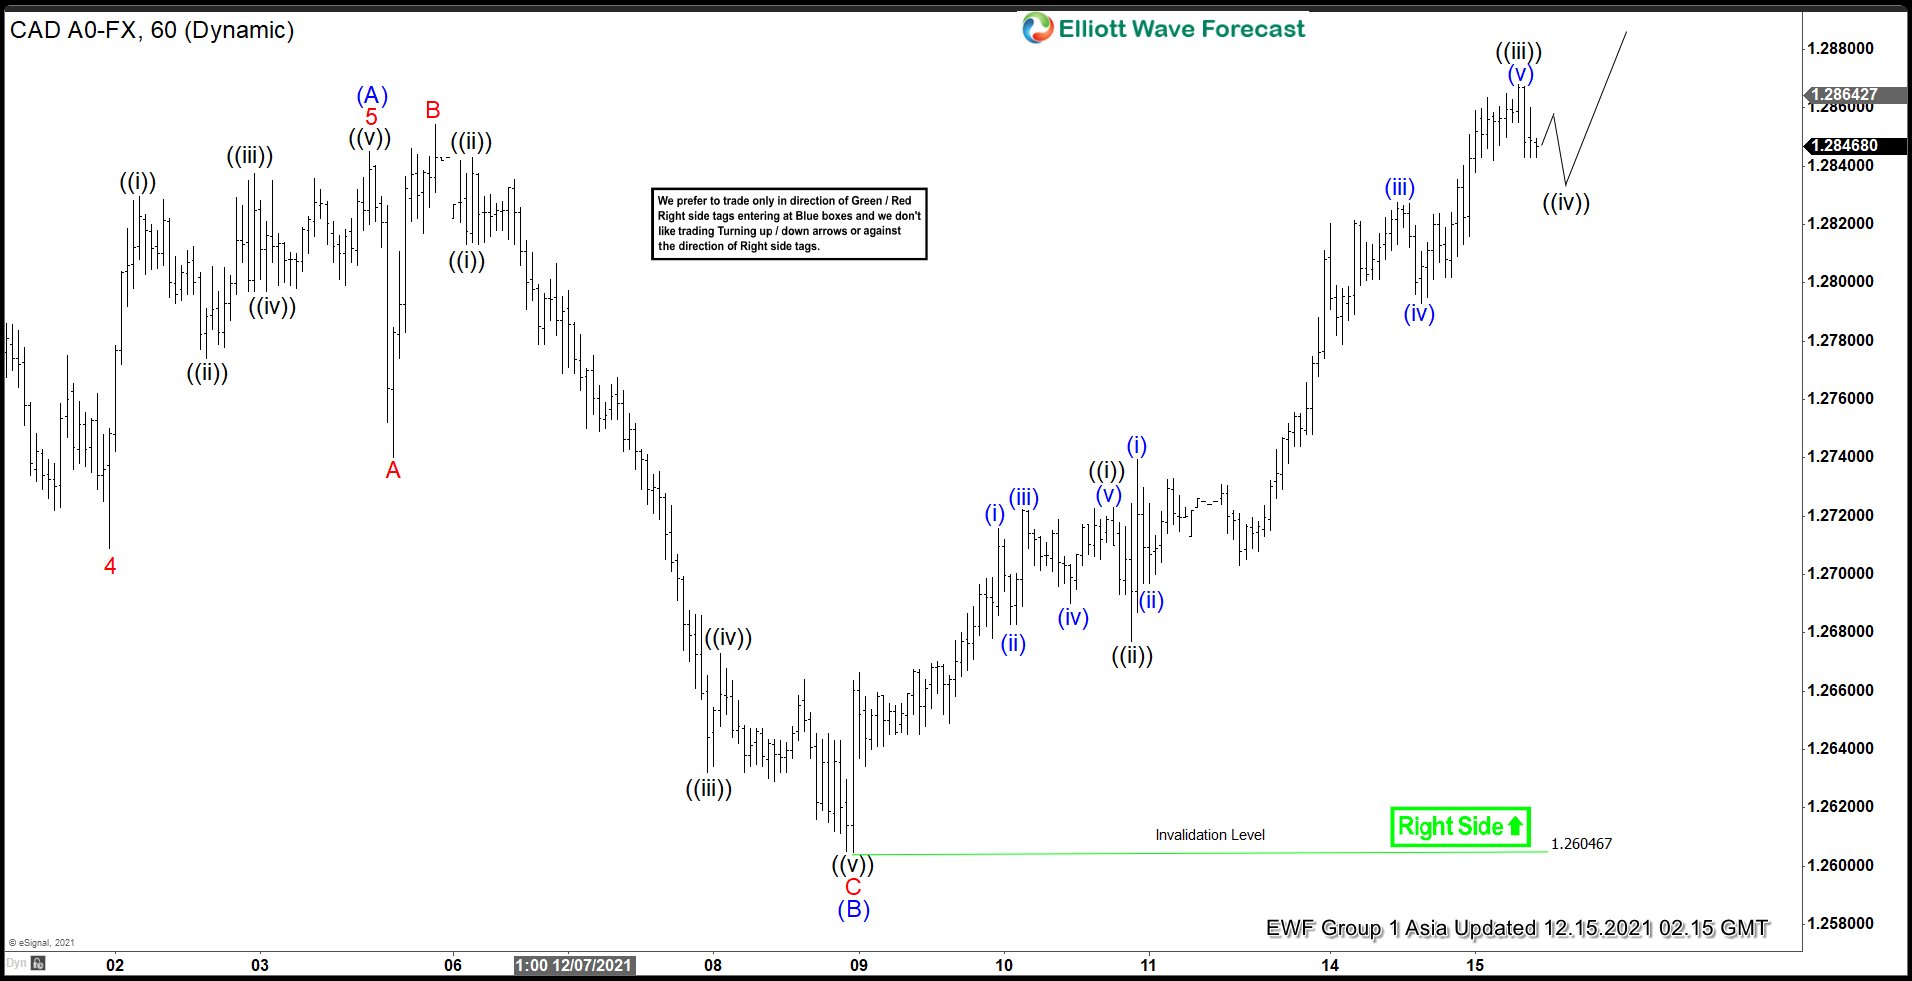
Short-term Elliott wave view in USDCAD suggests the rally from October 21, 2021 low is unfolding as a zigzag structure. Up from October 21 low, wave (A) ended at 1.2845 and pullback in wave (B) ended at 1.26047 as expanded flat. Down from wave (A), wave A ended at 1.274, wave B ended at 1.2854, and wave C of (B) ended at 1.26047. Pair has then turned higher and broken above previous high, suggesting the next leg wave (C) has started. Up from wave (B), wave ((i)) ended at 1.2722 and pullback in wave ((ii)) ended at 1.2677. Pair then resumed higher in wave ((iii)) towards 1.2868.
Pullback in wave ((iv)) is in progress in 3, 7, or 11 swing with potential target of 23.6 – 38.2% fibonacci retracement of wave ((iii)) at 1.2794 – 1.2822. Pair should then resume higher 1 more leg in wave ((v)) to end wave 1 of (C). It should then pullback again in larger degree wave 2 to correct cycle from December 8 low (1.2604) before turning higher again. Near term, as far as December 8 pivot holds, expect dips to find support in 3, 7, or 11 swing for further upside within wave (C). Potential target higher in wave (C) comes at 100% – 123.6% fibonacci extension of wave (A) towards 1.316 – 1.33.


