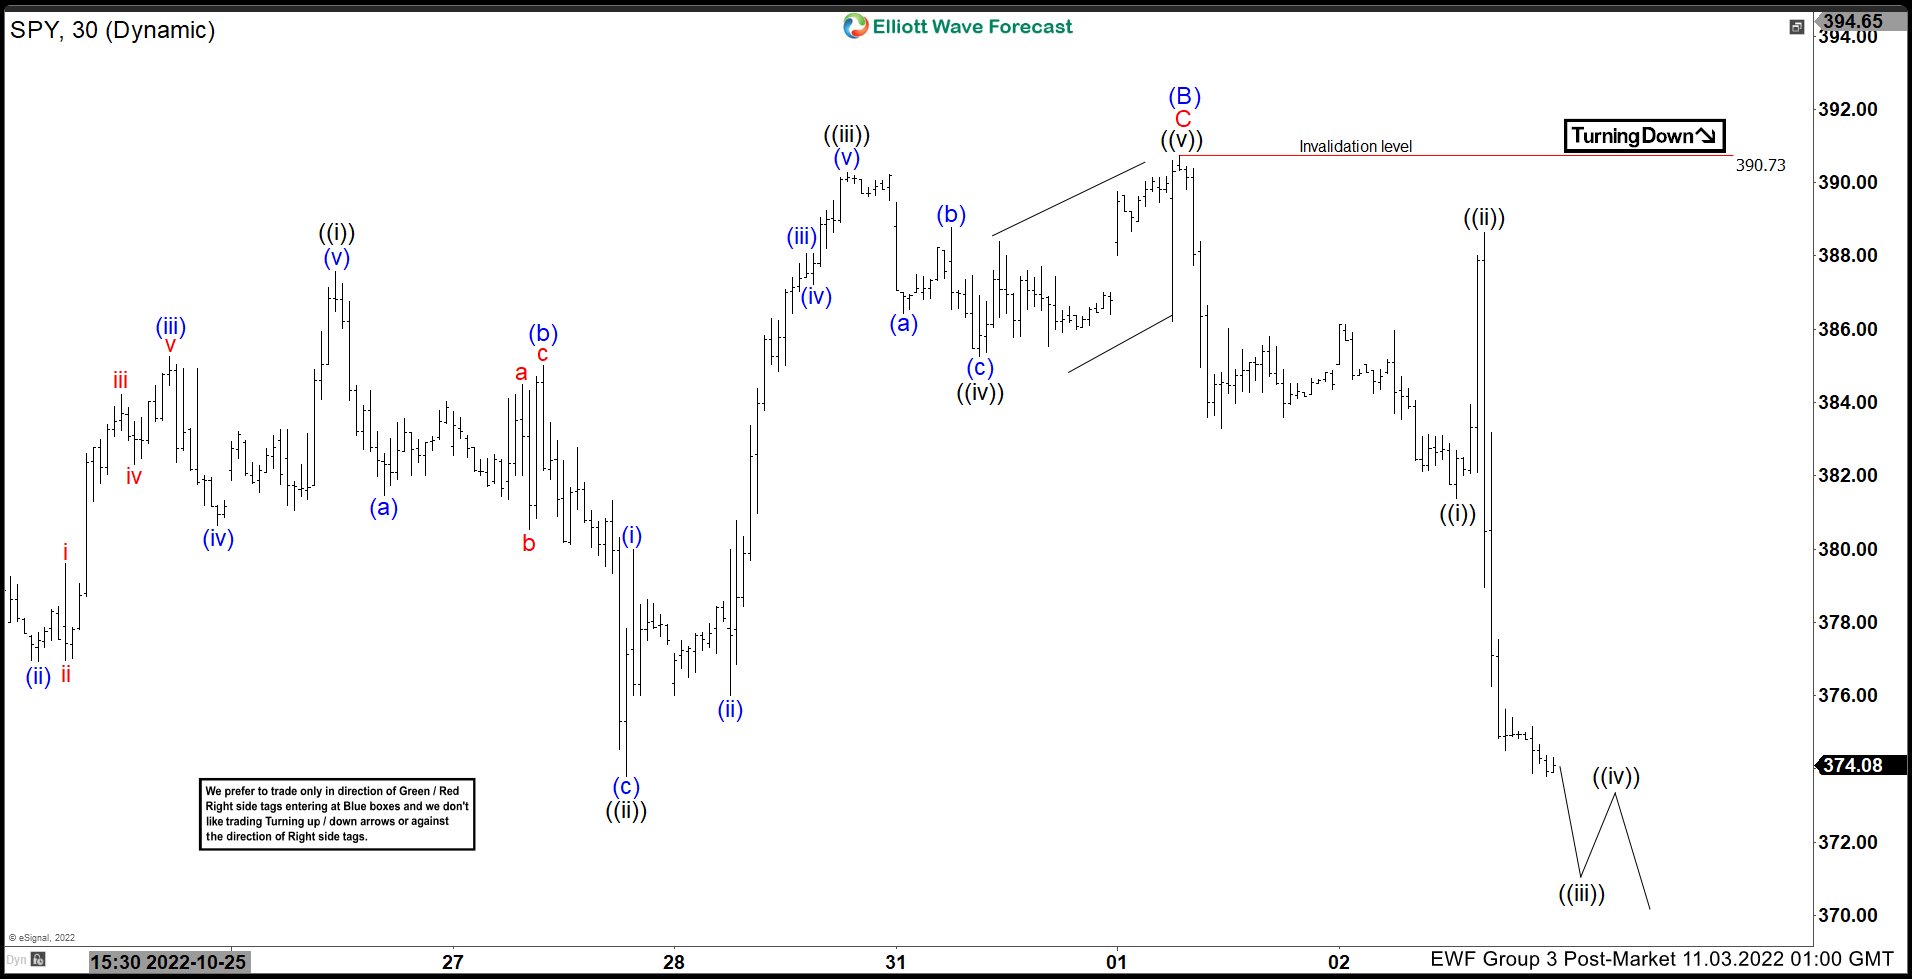
Short term Elliott Wave structure in $SPY suggests cycle from 8.16.2022 high is unfolding as a zigzag Elliott Wave structure. Down from 8.16.2022 high, wave (A) ended at 348.11. Up from there, Wave (B) ended at 390.73. The internal subdivision of wave (B) unfolded as a zigzag in lesser degree. Up from wave (A), wave A ended at 375.45 and pullback in wave B ended at 362.20. Wave C higher subdivided into 5 waves as the 30 minutes chart below shows.
Up from wave B, wave ((i)) ended at 387.58 and dips in wave ((ii)) ended at 373.80. Wave ((iii)) ended at 390.28, pullback in wave ((iv)) ended at 385.26, and final leg higher wave ((v)) ended at 390.73 which completed wave C of (B). Wave C completed at the 100% – 161.8% Fibonacci extension of wave A at 389 – 406. This is a typical area where a 3 waves rally should end. The ETF has turned lower in wave (C). Down from wave (B), wave ((i)) ended at 381.39 and rally in wave ((ii)) ended at 388.63. As far as pivot at 390.73 is intact, expect rally to fail in 3, 7, or 11 swing for further downside.


