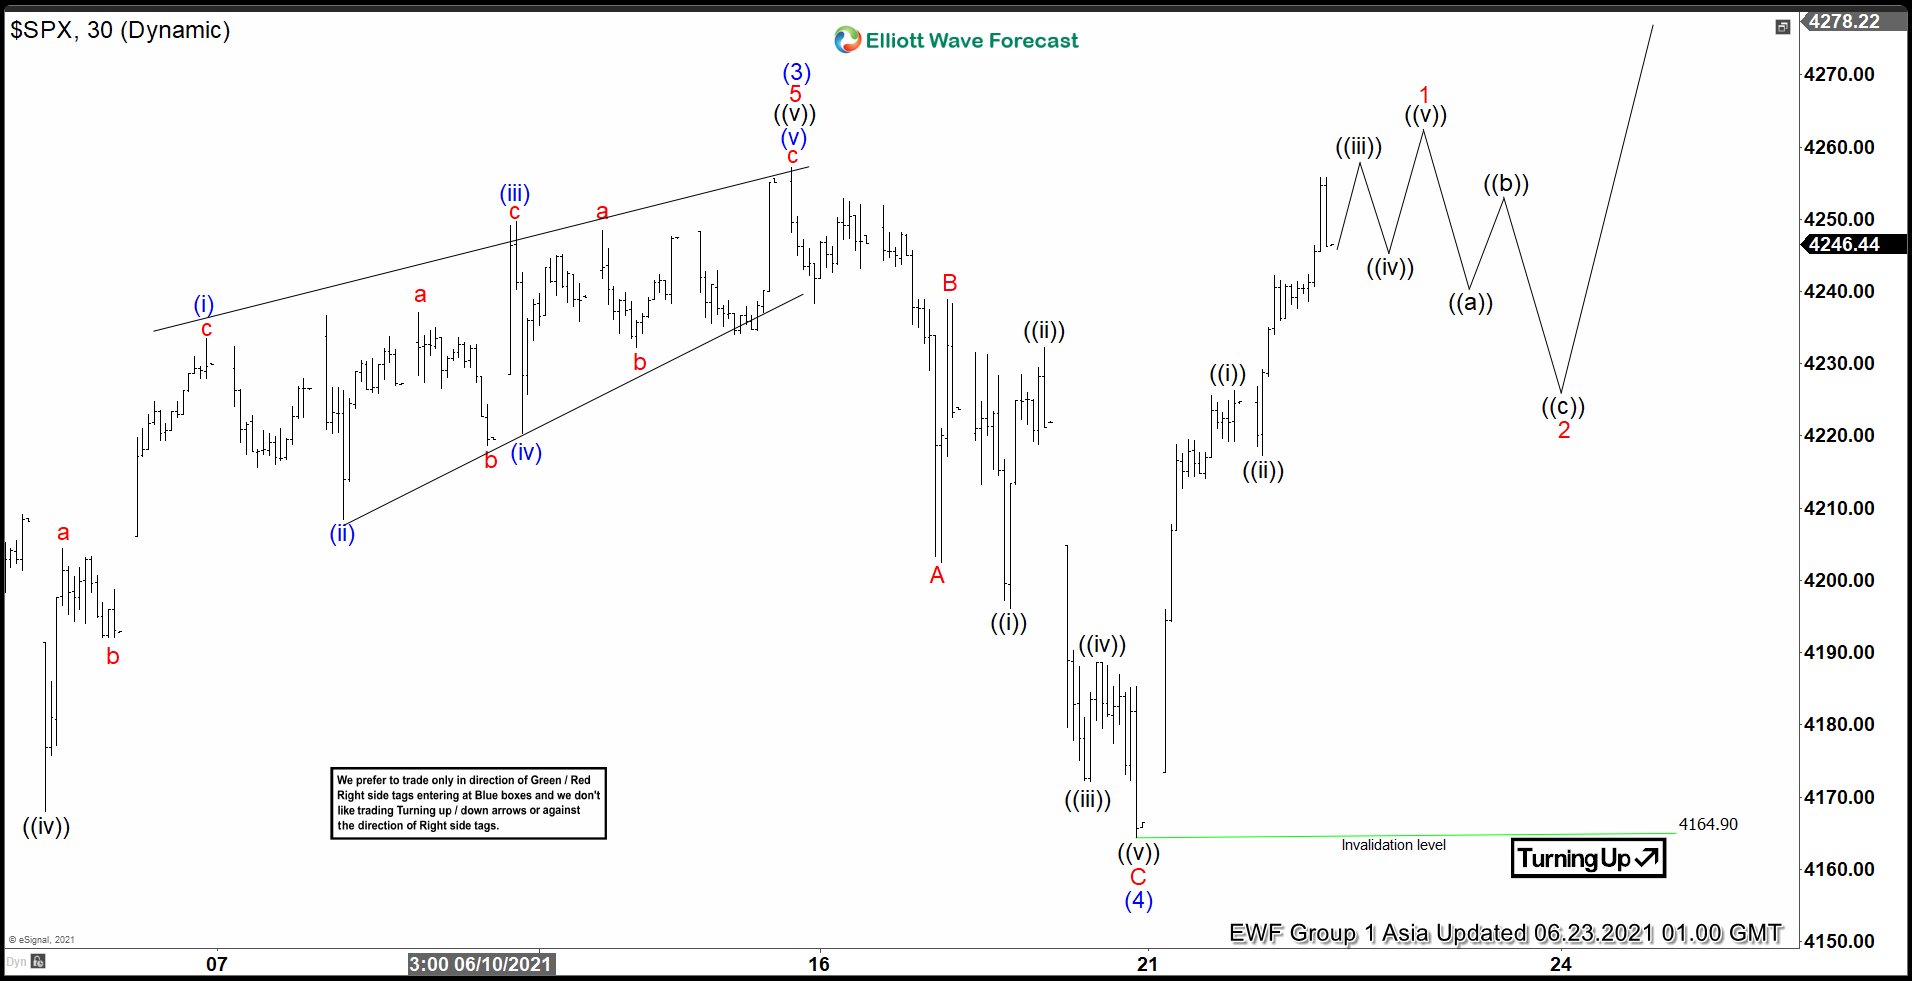
Elliott Wave View in S&P 500 (SPX) suggests the rally from September 25, 2020 low is unfolding as a 5 waves impulse Elliott Wave structure. Up from September 25, 2020 low, wave (1) ended at 3870.90 and pullback in wave (2) ended at 3694.12. The Index then extends higher in wave (3) towards 4257.16. The 30 minutes chart below shows the rally in this wave (3).
Pullback in wave (4) ended at 4164.90 as a zigzag structure. Down from wave (3), wave A ended at 4202.45, wave B ended at 4238.86, and wave C ended at 4164.90. The Index has turned higher in wave (5). A successful break above wave (3) high at 4257.16 should confirm that the next leg higher has started. Up from wave (4), wave ((i)) ended at 4226.24 and pullback in wave ((ii)) ended at 4217.27. Expect two more highs to end wave ((v)) which should complete wave 1 in higher degree. Afterwards, Index should pullback in wave 2 to correct cycle from June 19, 2021 low before the rally resumes. As far as June 19 low pivot at 4164.90 remains intact, expect dips to find support in 3, 7, or 11 swing for further upside.


