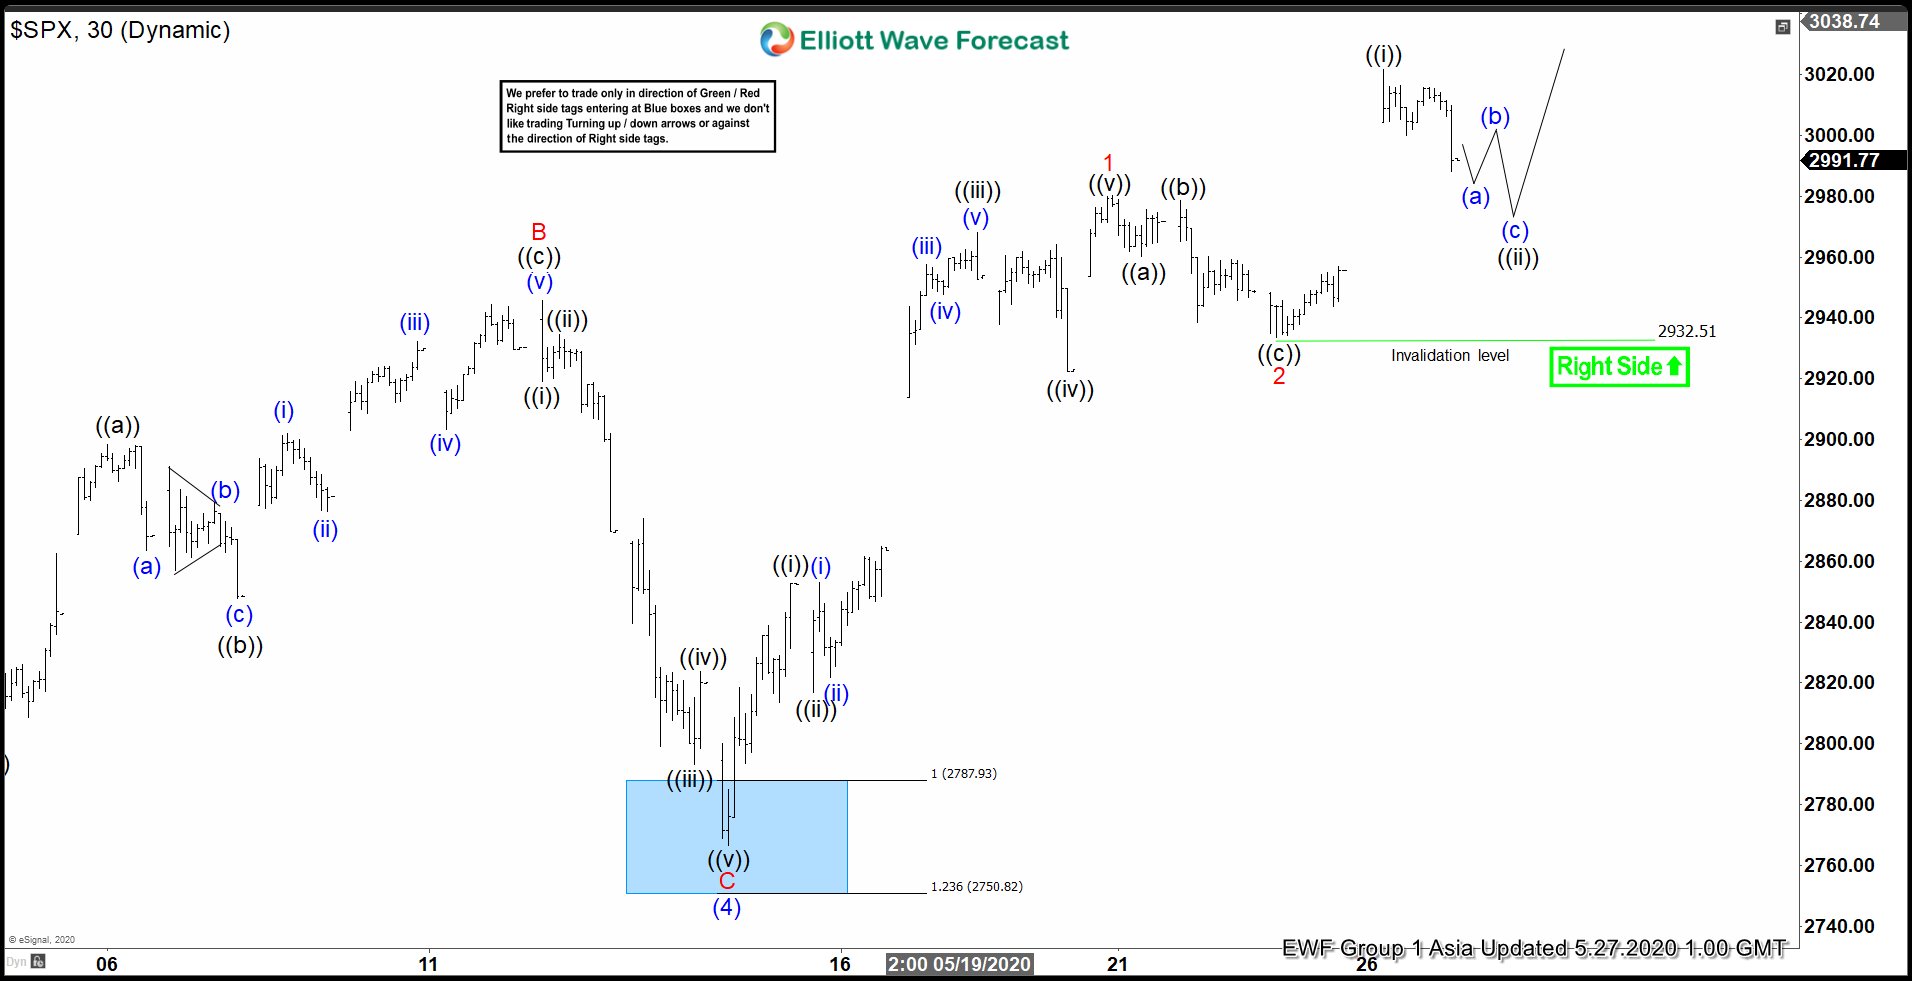
Short term Elliott Wave chart of S&P 500 (SPX) below suggests that the pullback to 2766.64 ended wave (4). This is part of an Impulsive rally which started on 3.23.2020 low. The Index is currently in wave (5) which is unfolding as an Elliott wave impulsive structure. Up from wave (4) at 2766.64 low, wave 1 ended at 2980.29 as an impulse in lesser degree. Wave ((i)) ended at 2852.73 and wave ((ii)) pullback ended at 2816.78. Index then resumes higher in wave ((iii)) towards 2968.09, wave ((iv)) dips ended at 2922.35, and finally wave ((v)) ended at 2980.29. This 5 waves move ended wave 1 in higher degree and completed cycle from 5.14.2020 low.
Wave 2 pullback then ended at 2932.51 as a zigzag. Down from 2980.29, wave ((a)) ended at 2960.24, wave ((b)) ended at 2978.50, and wave ((c)) of 2 ended at 2933.59. Index has resumed higher again in wave 3 by breaking above wave 1 at 2980.29. Near term, while pullback stays above 2932.51, expect the Index to extend higher. Potential minimum target higher is 100% – 123.6% of wave 1 which comes at 3145 – 3195. Alternatively, if pivot at 2932.51 breaks, then Index ended wave 1 at the last high and now still correcting the cycle from 5.14.2020 low in 3, 7, or 11 swing before the rally resumes.


