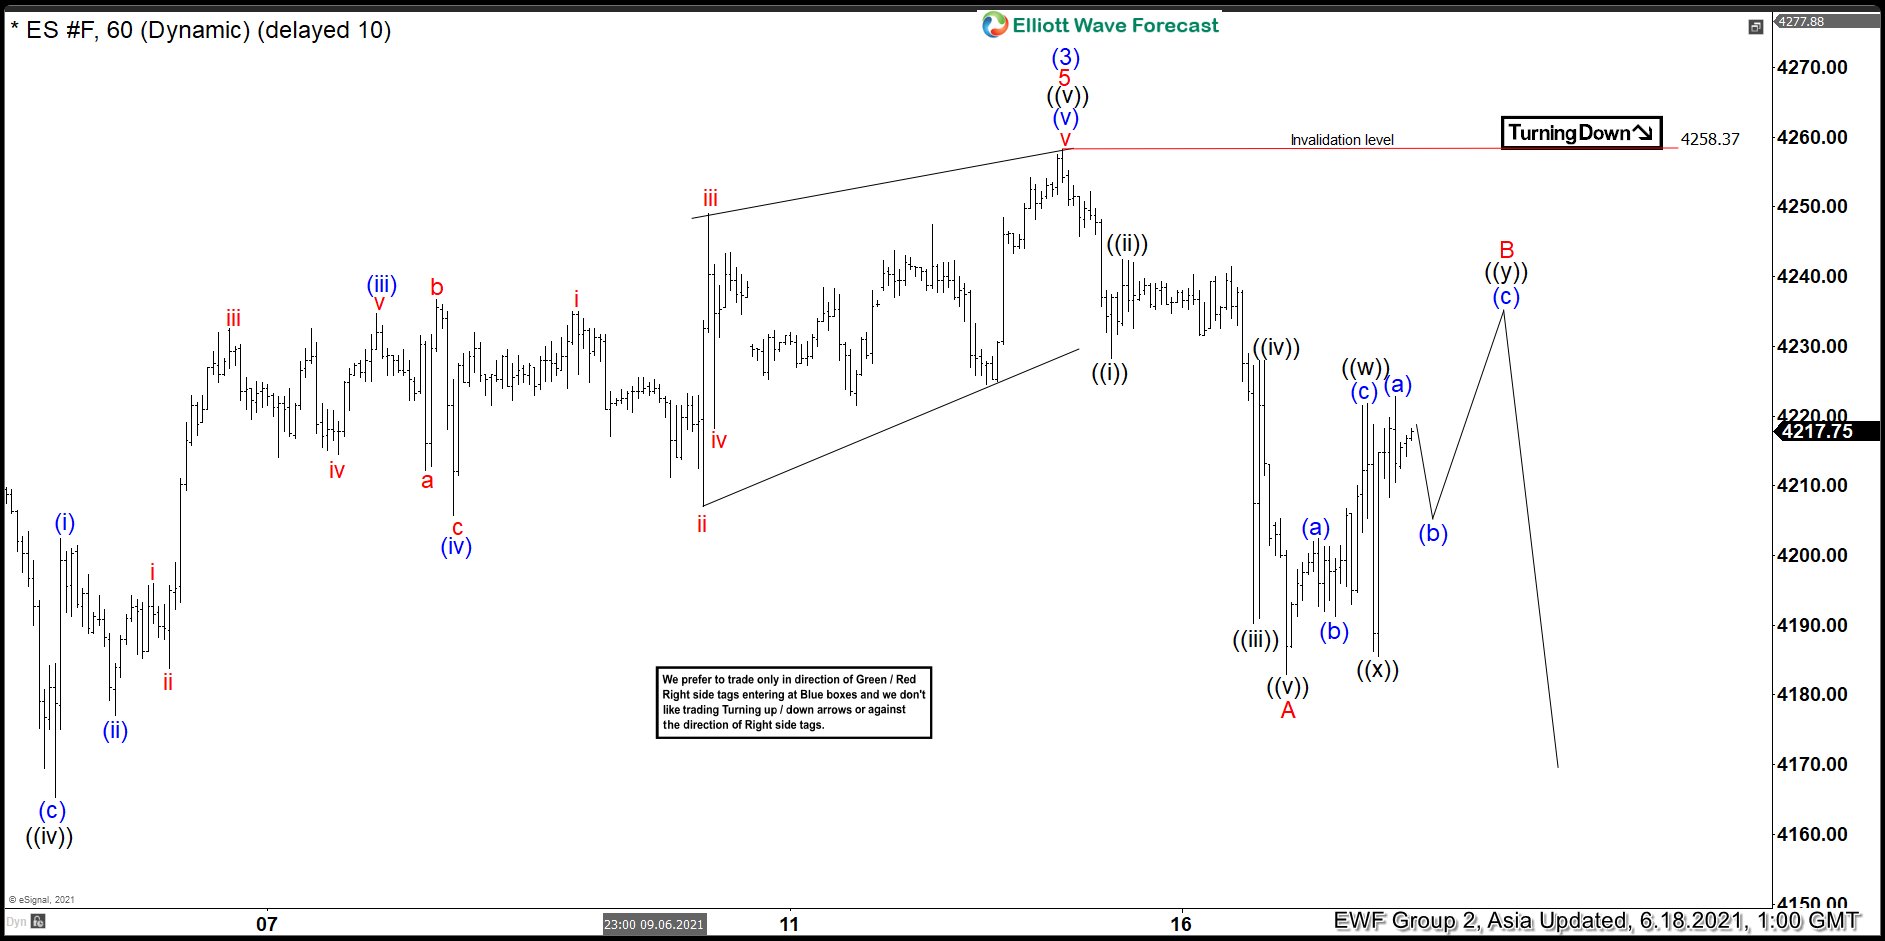
Short Term Elliott Wave view in S&P 500 E-Mini Futures (ES) from October 2020 low is unfolding as an impulse Elliott Wave structure. In the 60 minutes chart below, we can see the rally to 4258.37 ended wave (3) of this impulse. Wave (4) is currently in progress to correct cycle from February 1, 2020 low before the rally resumes. Internal subdivision of wave (4) is unfolding as a zigzag Elliott Wave structure.
Down from wave (3), wave ((i)) ended at 4228.25 and bounce in wave ((ii)) ended at 4242.50. The Index resumes lower in wave ((iii)) towards 4190.25, bounce in wave ((iv)) ended at 4228 and final leg lower wave ((v)) ended at 4183. This completes larger degree wave A of the zigzag structure. Index is now correcting cycle from June 15 high in wave b as a double three structure.
Up from wave A, wave ((w)) ended at 4221.75, and pullback in wave ((x)) ended at 4185.50. Expect Index to rally higher to complete wave ((y)) of B before turning lower again. Near term, as far as pivot at 4258.37 high stays intact, expect rally to fail in 7 swing for further downside.


