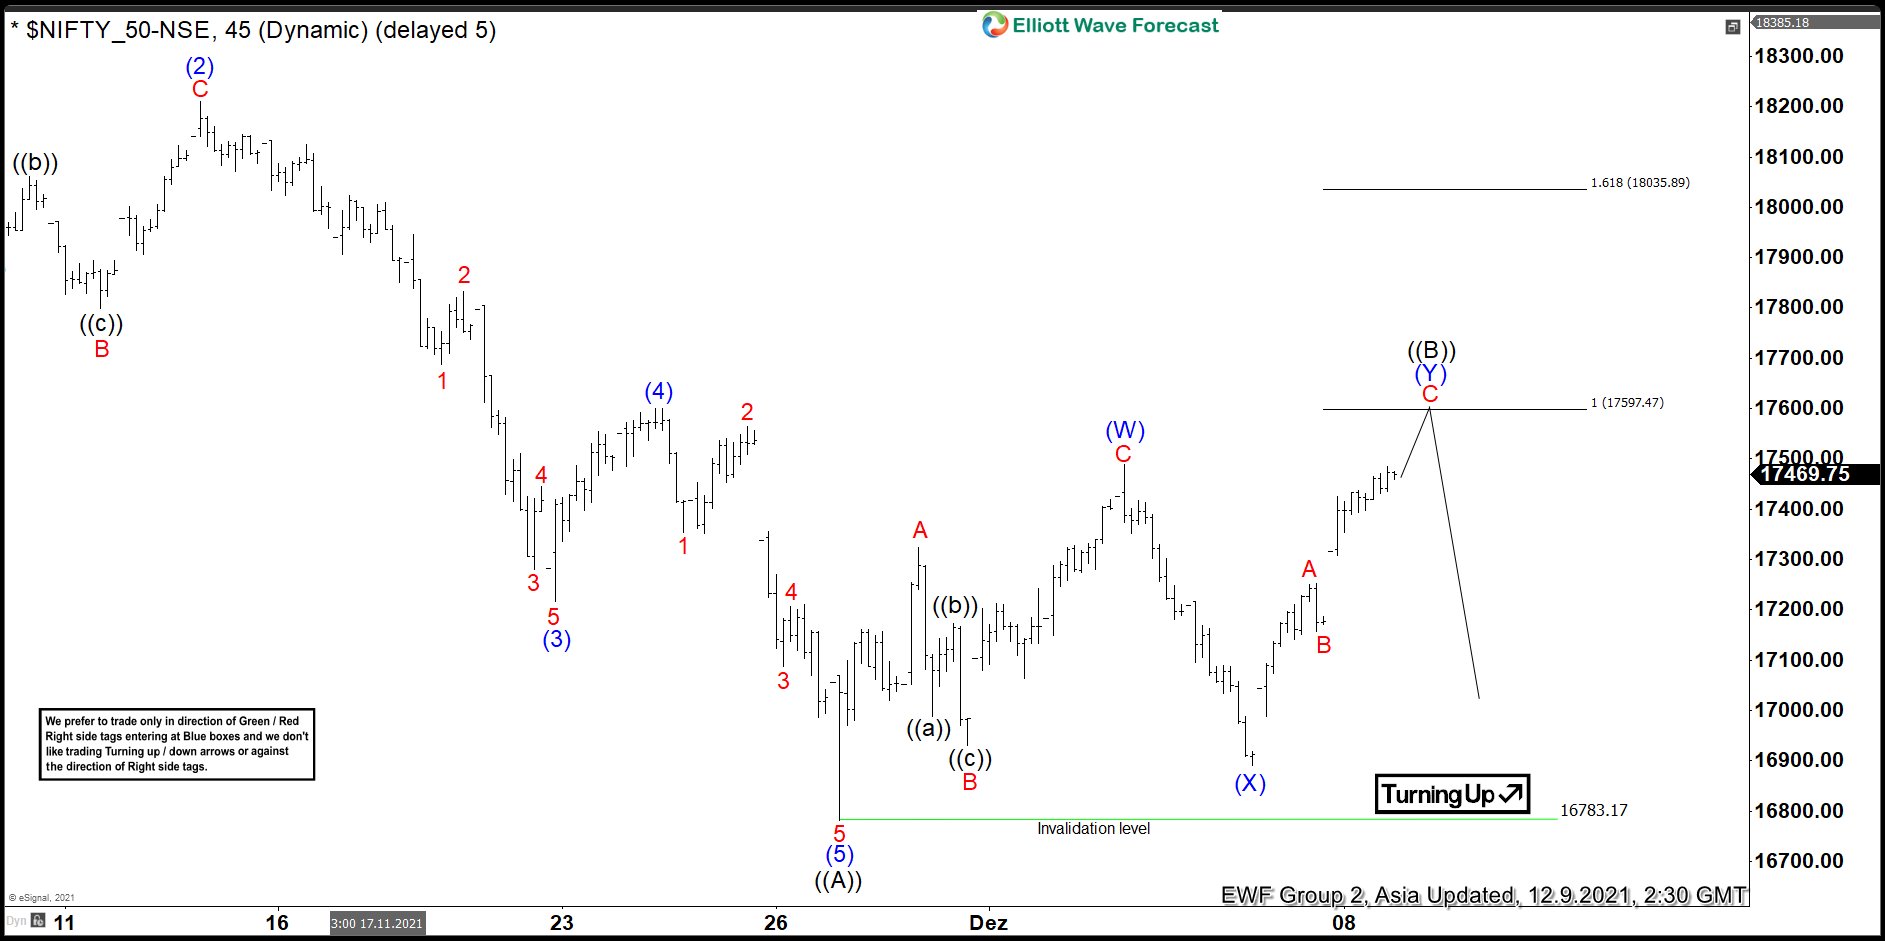
Short term Elliott Wave View in Nifty suggests cycle from October 19 peak ended at 16796.56 with wave ((A)). Internal subdivision of wave ((A)) unfolded as a 5 waves impulse Elliott Wave structure. Down from October 19 peak, wave (1) ended at 17613.1, and rally in wave (2) ended at 18210.15. Index then resumes lower in wave (3) towards 17216.10 and bounce in wave (4) ended at 17599.75. Final leg lower wave (5) ended at 16796.56 which also completed wave ((A)) in higher degree.
The Index is now correcting cycle from October 19 peak in wave ((B)). The internal subdivision of wave ((B)) is unfolding as a double three Elliott Wave structure. Up from wave ((A)), wave A ended at 17324.65, dips in wave B ended at 16931.40, and wave C ended at 17489.8. This completed wave (W) of the double three. Index then pullback in wave (X) which ended at 16891.70. Index then turns higher in wave (Y) with internal as a zigzag. Up from wave (X), wave A ended at 17251.65 and wave B pullback ended at 17158.05. Near term, expect Index to extend higher towards 17597.47 – 18035.89 to finish wave (Y) of ((B)). From here, the Index then can resume lower in wave ((C)) or at least pullback in 3 waves.


