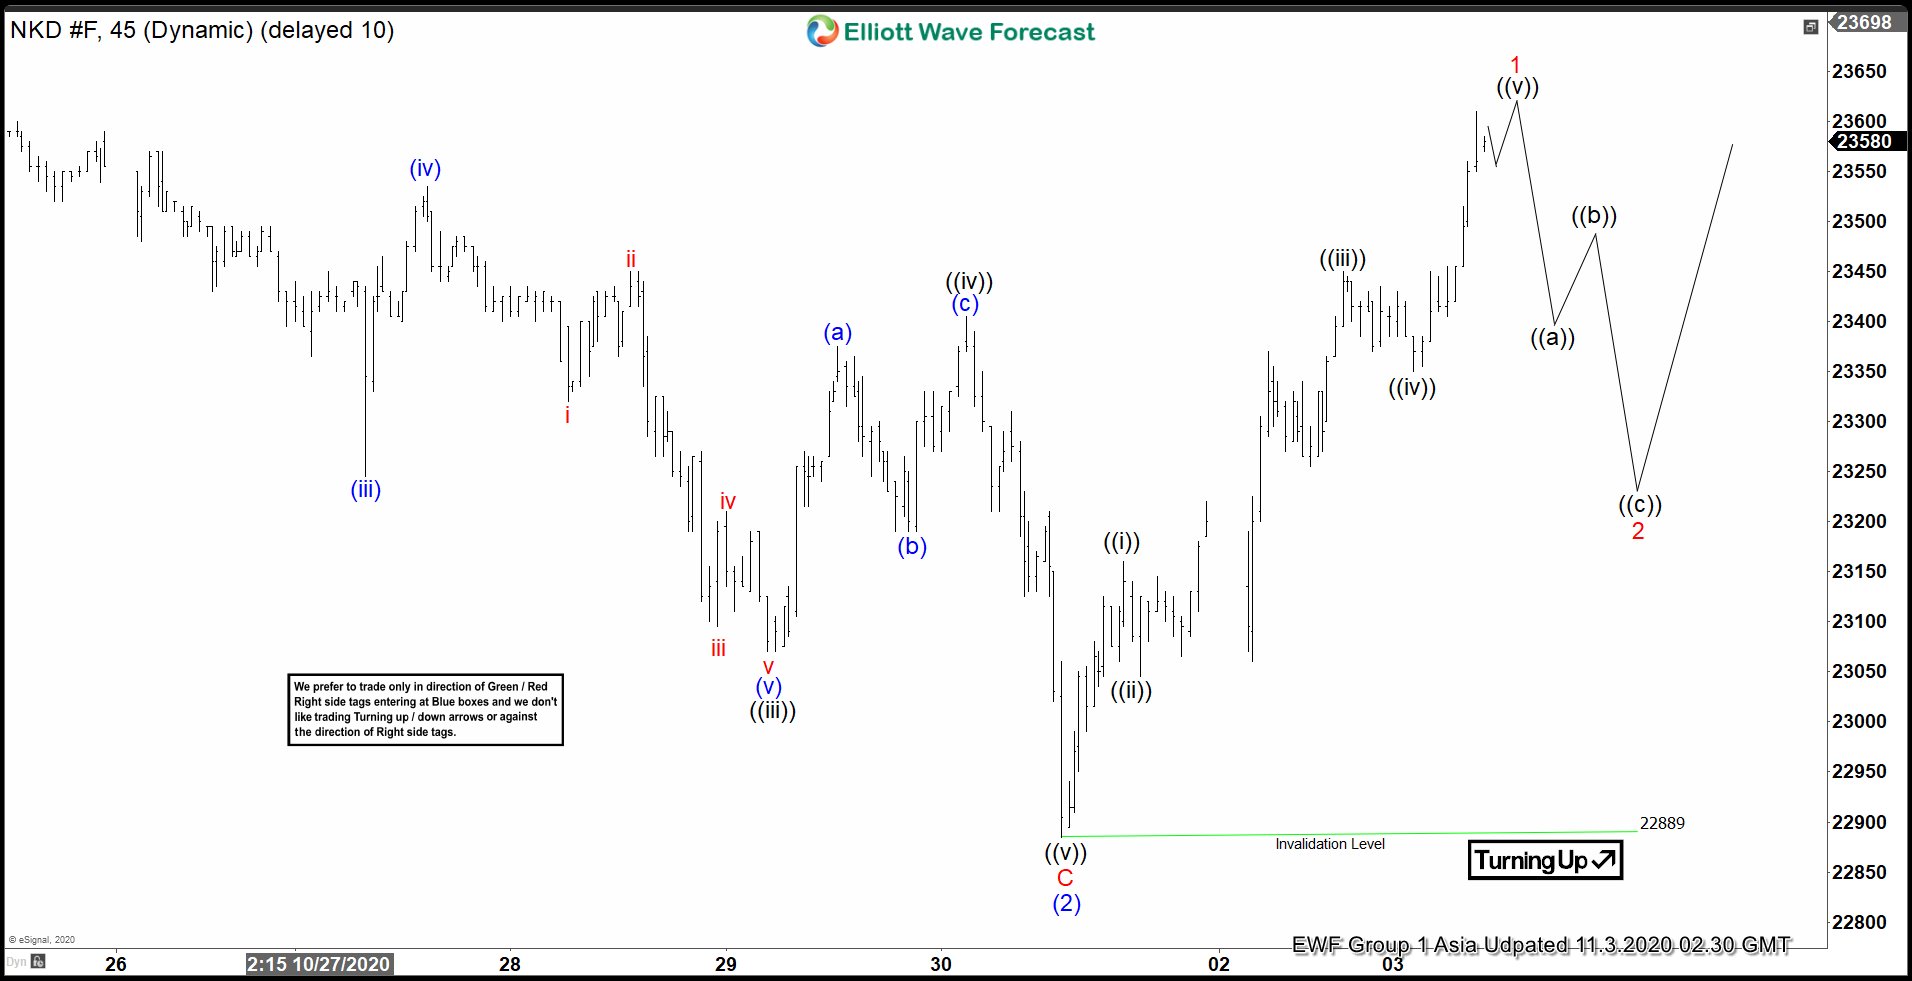
Short term Elliott Wave view on Nikkei (NKD) suggests the Index ended cycle from October 9 peak in wave (2) at 22889. Subdivision of wave (2) unfolded as a zigzag. Down from October 9 peak, wave A ended at 23380 and wave B ended at 23705. Wave C of (2) ended at 22889 which can be seen in the 45 minutes chart below. Index has since turned higher in wave (3). However, it still needs to break above the previous peak on October 9 peak at 23765. Up from wave (2) low at 22889, wave ((i)) ended at 23160 and pullback in wave ((ii)) ended at 23045.
Index resumed higher in wave ((iii)) towards 23450 and pullback in wave ((iv)) ended at 23350. Index should end wave ((v)) soon and this should complete a 5 waves impulsive rally wave 1 in higher degree. Afterwards, Index should pullback in wave 2 as a zigzag to correct cycle from October 30 low before the rally resumes. As far as wave (2) pivot low at 22889 stays intact, expect pullback to find support in 3, 7, or 11 swing. Potential minimum target higher in wave (3) is 100% – 123.6% Fibonacci extension from September 21 low, which comes at 24123 – 24417.


