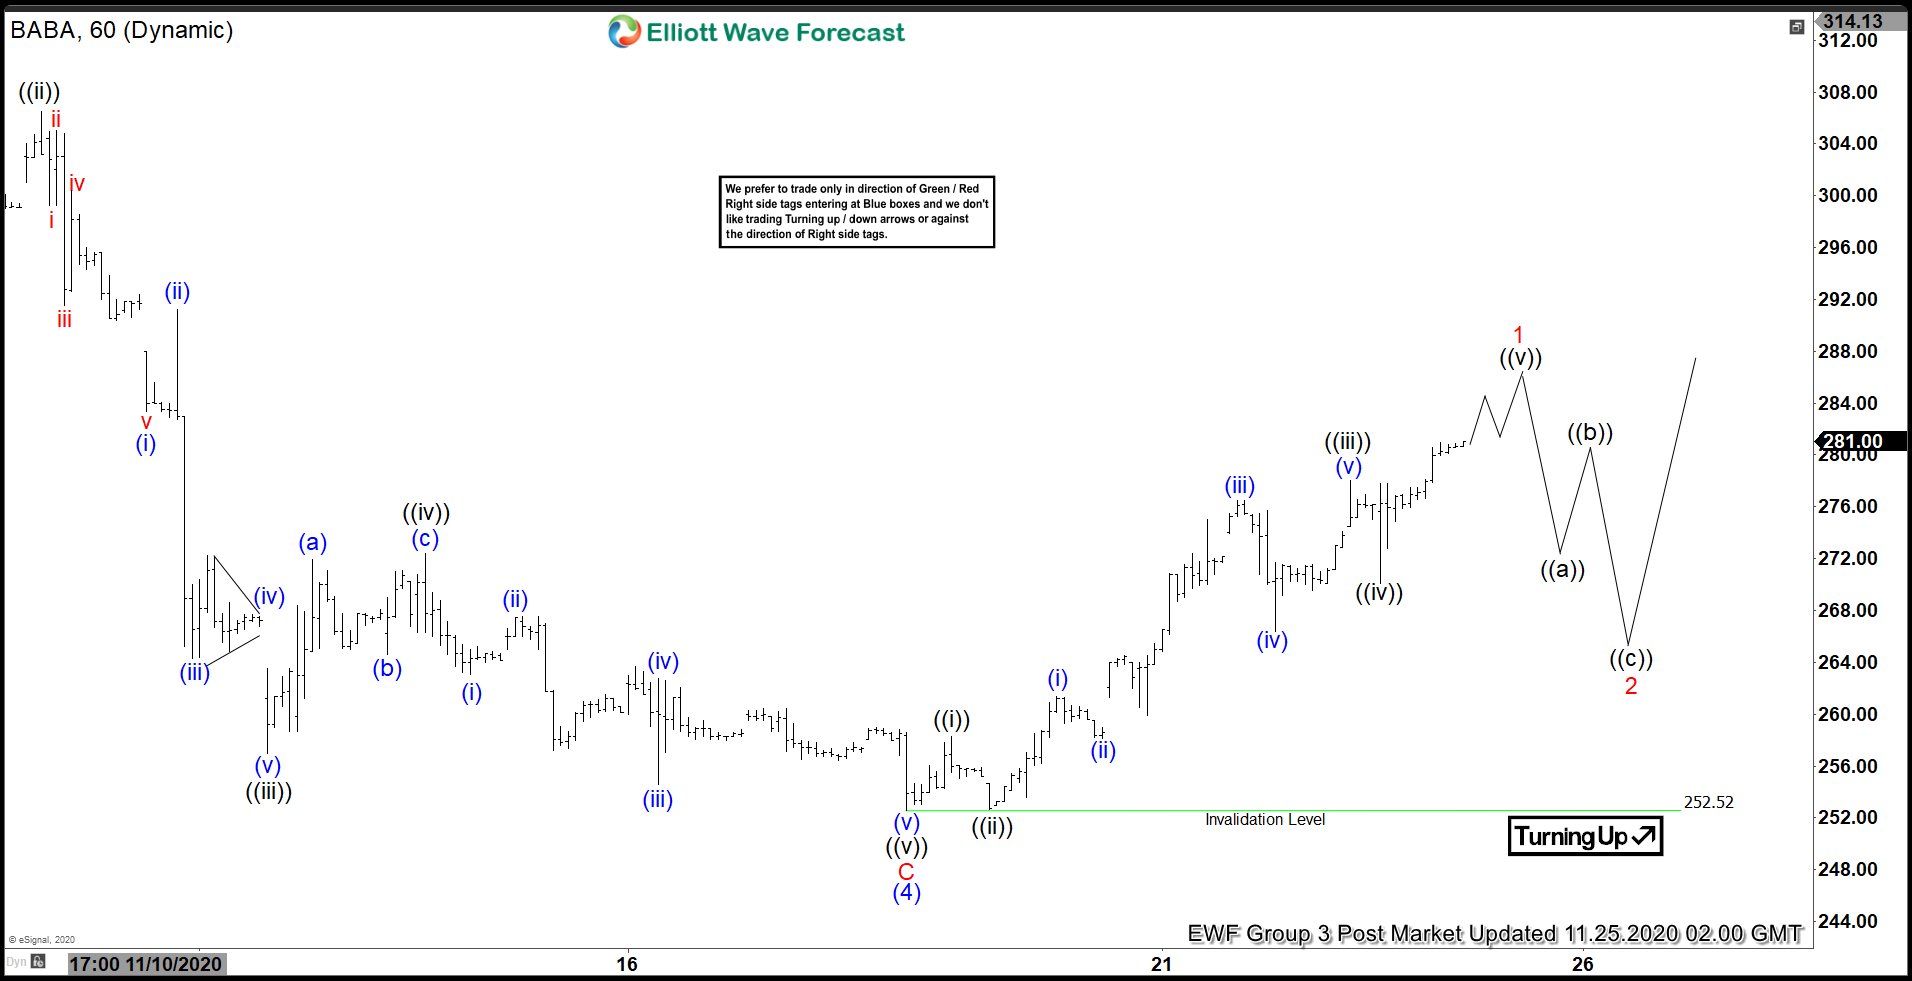
Short Term Elliott Wave view in Alibaba suggests the decline from October 27 peak has ended at $252.5 as wave (4). The internal subdivision of wave (4) unfolded as a zigzag Elliott Wave structure. The 60 minutes chart below shows wave C of that zigzag which completed at $252.5. The stock has since turned higher in wave (5).
Alibaba however still needs to break above wave (3) at $319.3 to rule out a double correction in wave (4). Short term rally from wave (4) low at 252.52 is unfolding as a 5 waves impulse structure. Up from wave (4) low, wave ((i)) ended at 258.31 and pullback in wave ((ii)) ended at 252.67. Stock then resumed higher in wave ((iii)) towards 278, and pullback in wave ((iv)) ended at 270.11. Expect the stock to finish wave ((v)) soon and this complete wave 1 of (5) in higher degree. Afterwards, it should pullback in wave 2 of (5) to correct cycle from November 18 low before the rally resumes. As far as November 18 pivot low at 252.52 holds, expect the stock to find support in 3, 7, or 11 swing for the next leg higher.


