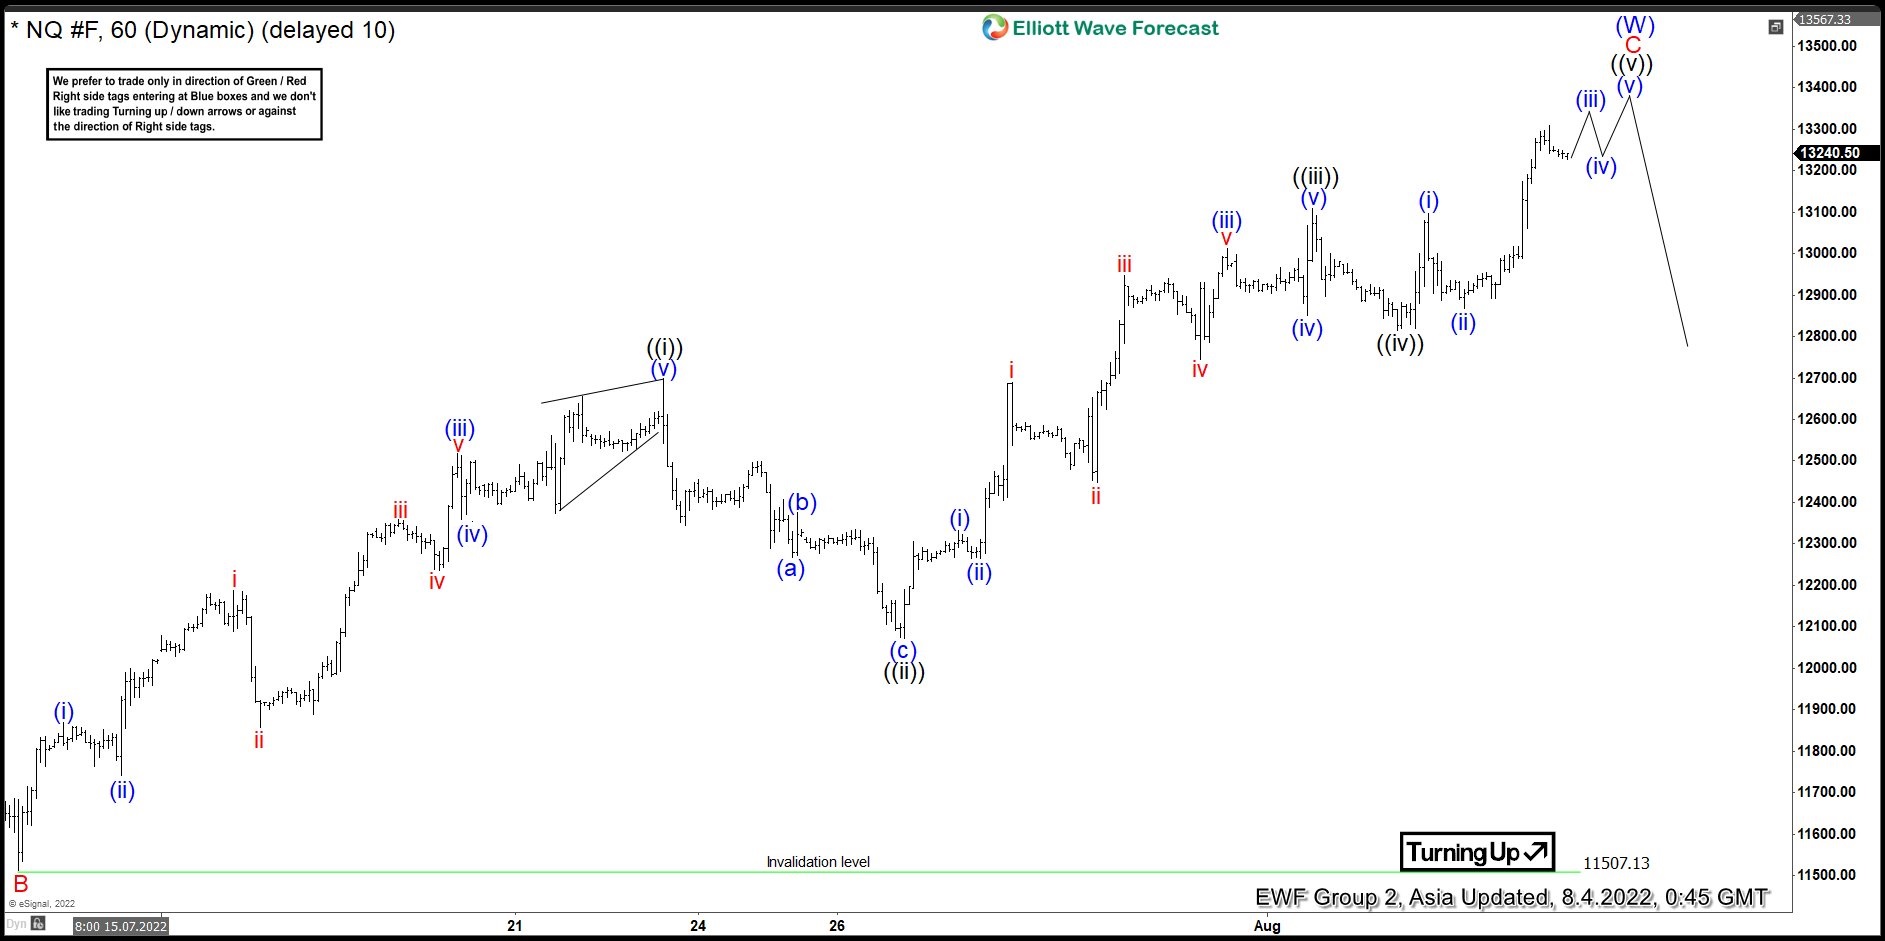
Short Term Elliott Wave View suggests rally from 6.17.2022 low is unfolding as a zigzag Elliott Wave structure. Up from 6.17.2022 low, wave A ended at 12262 and pullback in wave B ended at 11507. 13. Wave C higher is in progress as a 5 waves impulse structure. Up from wave B, wave ((i)) ended at 12698.50 and pullback in wave ((ii)) ended at 12072. Index then resumes higher in wave ((iii)) towards 13108.75, and dips in wave ((iv)) ended at 12814.75.
Index can see a little bit more upside to end wave ((v)) of C. This would also complete wave (W) in larger degree and end cycle from 6.17.2022 low. Afterwards, it should correct the rally from 6.17.2022 low in larger degree 3 , 7, or 11 swing within wave (X) before Index then resumes higher again. Nasdaq is currently already at the 100% – 161.8% Fibonacci extension from 6.17.2022 low which comes at 12728 – 13473. Ideally wave (W) ends somewhere within this area before the larger pullback in wave (X). If the Index continues to extend to 13473 or higher, there’s a higher chance the rally from 6.17.2022 will become impulsive 5 waves instead of a zigzag.


