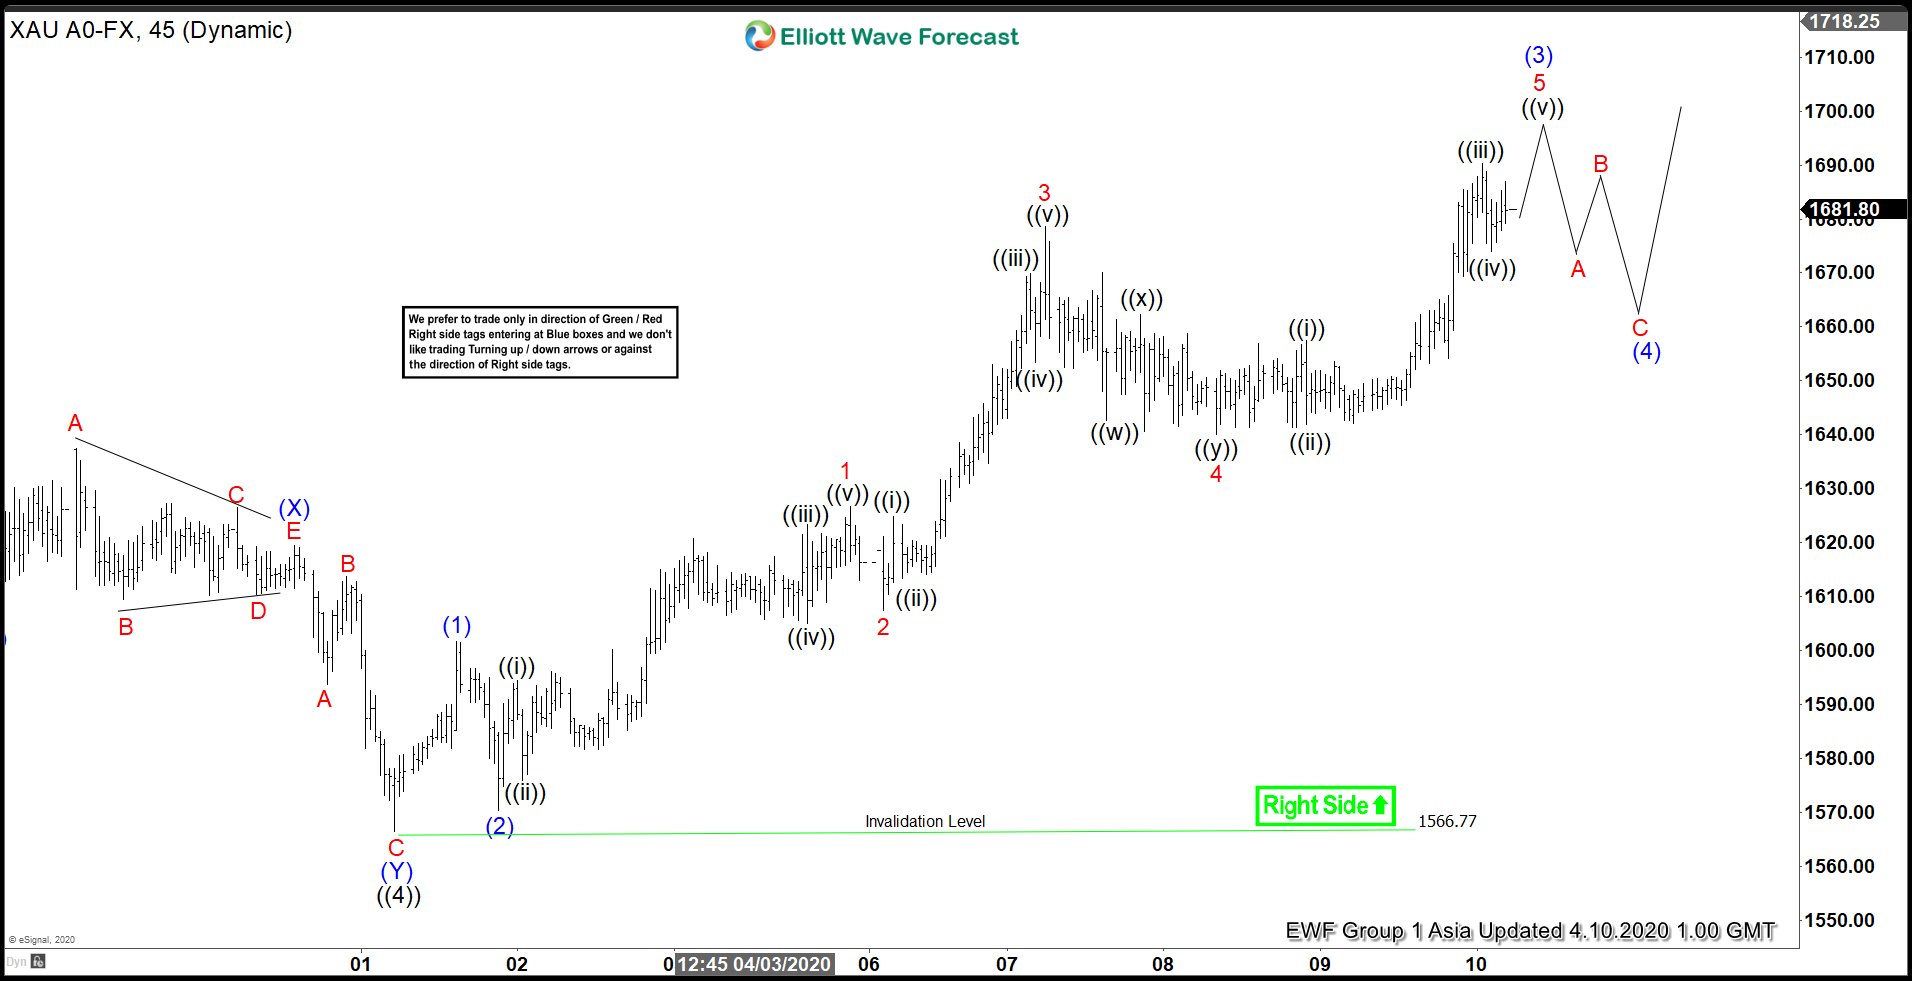
Short Term Elliott Wave View suggests rally in Gold (XAUUSD) from March 16 low is unfolding as a 5 waves impulse Elliott Wave structure. Up from March 16 low, wave ((1)) ended at 1519.57, and pullback in wave ((2)) ended at 1454.90. The precious metal has resumed higher in wave ((3)) towards 1645.5 and wave ((4)) pullback ended at 1566.53. Gold has broken above wave ((3)) at 1645.5 suggesting wave ((5)) has resumed. Structure of wave ((5)) is unfolding as another impulsive structure in lesser degree.
Up from April 1 wave ((4)) low (1566.7), wave (1) ended at 1601.7, and pullback in wave (2) ended at 1570.5. Wave (3) shows an extension where wave 1 ended at 1626.8, and wave 2 ended at 1607.4. Wave 3 ended at 1678.6, wave 4 pullback ended at 1661.3, and the metal is in the process of ending wave 5 of (3). Near term, while dips stay above April 1 low (1566.7), expect the metal to resume higher a few times. When Gold ends wave ((5)), it will also complete the cycle from March 16 low. Afterwards, it should see a larger pullback to correct that cycle. We don’t like selling Gold.
Gold 1 Hour Elliott Wave Chart


