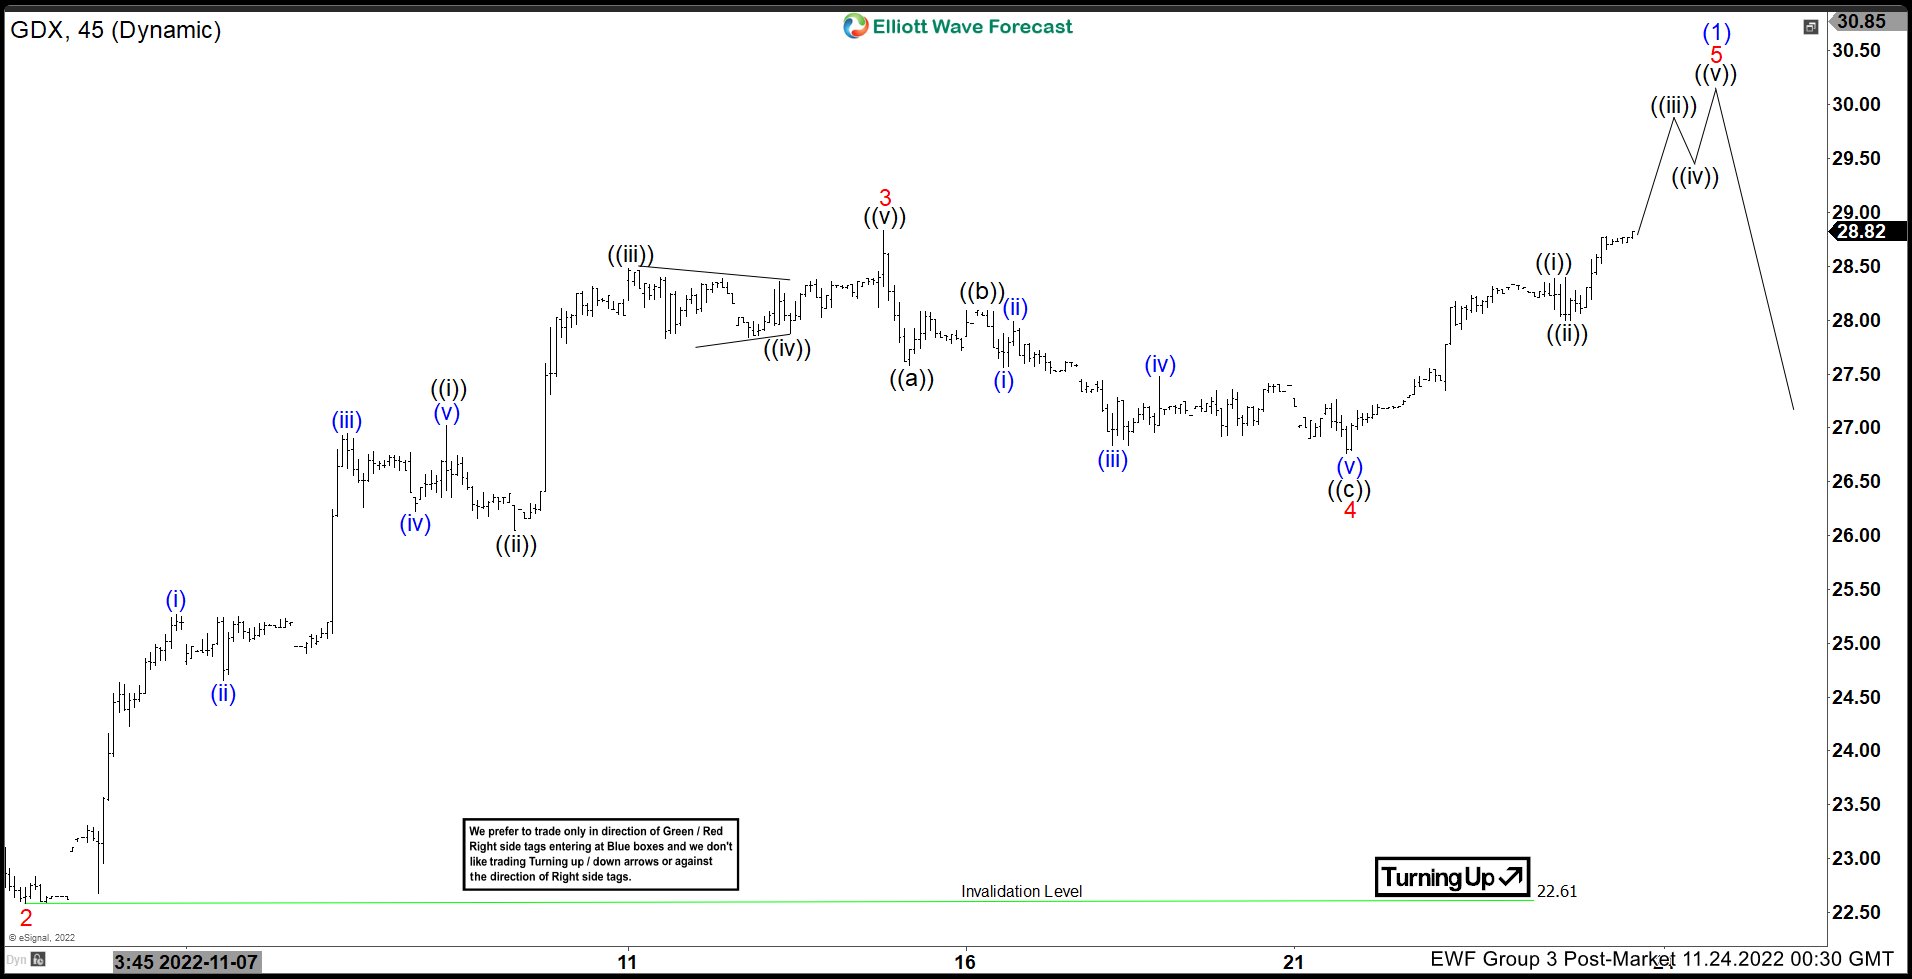
Short term Elliott Wave View in Gold Miners ETF (GDX) suggests it has started a new bullish cycle from 10.13.2022 low. The rally from there is unfolding as a 5 waves impulse Elliott Wave structure. Up from there, wave 1 ended at 25.4 and dips in wave 2 ended at 22.58. The ETF extends higher again in wave 3 towards 28.49 as the 45 minutes chart below shows. Internal of wave 3 unfolded as another 5 waves in lesser degree. Up from wave 2, wave ((i)) ended at 27.02 and pullback in wave ((ii)) ended at 26.05.
ETF extended higher in wave ((iii)) towards 28.48, and dips in wave ((iv)) ended at 27.88 as a triangle. The last leg higher wave ((v)) ended at 28.83 which completed wave 3. Pullback in wave 4 ended at 26.76 with subdivision as a zigzag. Down from wave 3, wave ((a)) ended at 27.57 and rally in wave ((b)) ended at 28.09. Wave ((c)) lower ended at 26.76 which completed wave 4. GDX has rallied higher again in wave 5. Up from wave 4, wave ((i)) ended at 28.40 and dips in wave ((ii)) ended at 28. Expect the ETF to extend a few more highs before ending wave 5 of (1). Afterwards, it should pullback in wave (2) to correct cycle from 10.13.2022 low in 3, 7, or 11 swing before the rally resumes.


