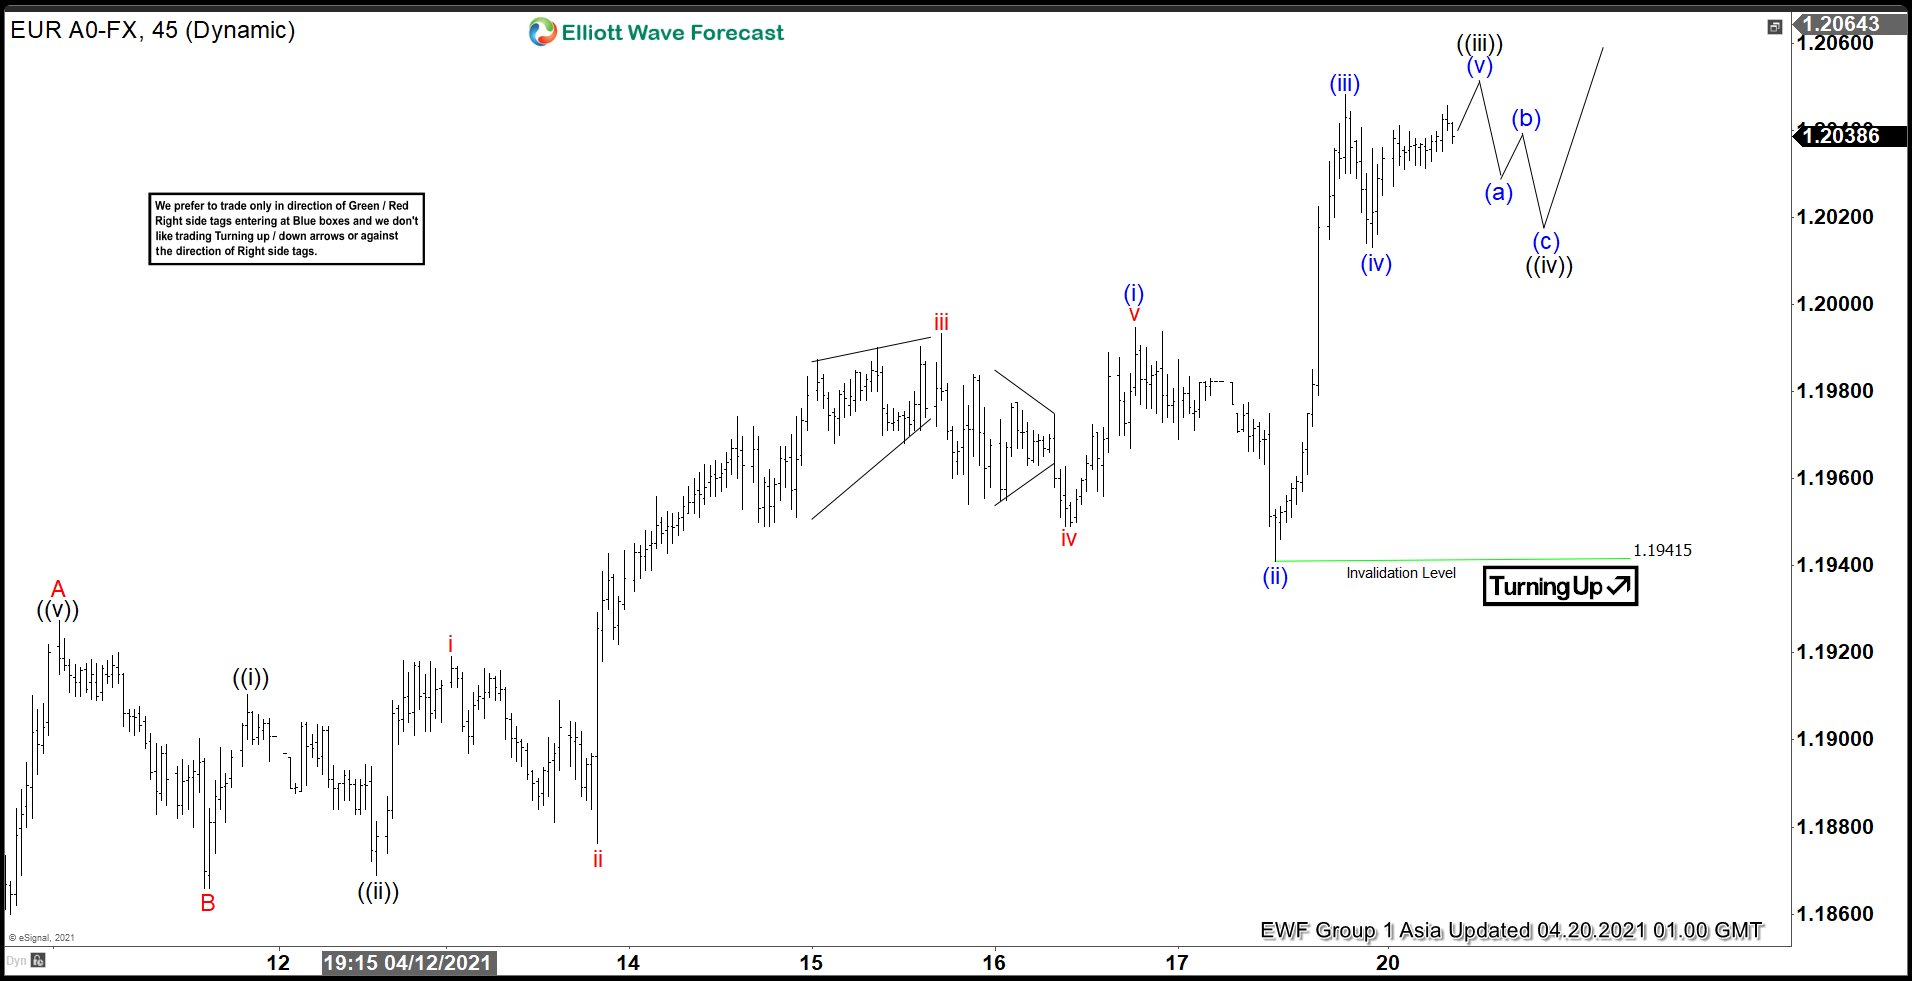
Short term Elliott wave view in EURUSD suggests the rally from March 31 low is unfolding as a Zigzag Elliott Wave structure. Up from March 31 low, wave A ended at 1.19275 and pullback in wave B ended at 1.1866. Pair has resumed higher in wave C which subdivides as a nesting impulse in lesser degree. Up from wave B low, wave ((i)) ended at 1.191 and pullback in wave ((ii)) ended at 1.1869.
Pair then resumed higher as a nest and ended wave (i) of ((iii)) at 1.19948. Pullback in wave (ii) of ((iii)) ended at 1.1941. Wave (iii) of ((iii)) ended at 1.2048, and wave (iv) of ((iii)) ended at 1.2013. Final leg higher wave (v) of ((iii)) is expected to end soon. Afterwards, pair should pullback in wave ((iv)) to correct cycle from April 12 low before the rally resumes. Expect dips to continue to find support in 3, 7, or 11 swing for further upside as long as wave ((ii)) low at 1.1869 remains intact. Potential target higher is the 100% – 161.8% Fibonacci extension from March 31 low which comes at 1.209 – 1.223. From this area, pair can start to turn lower in 3 waves at least.


