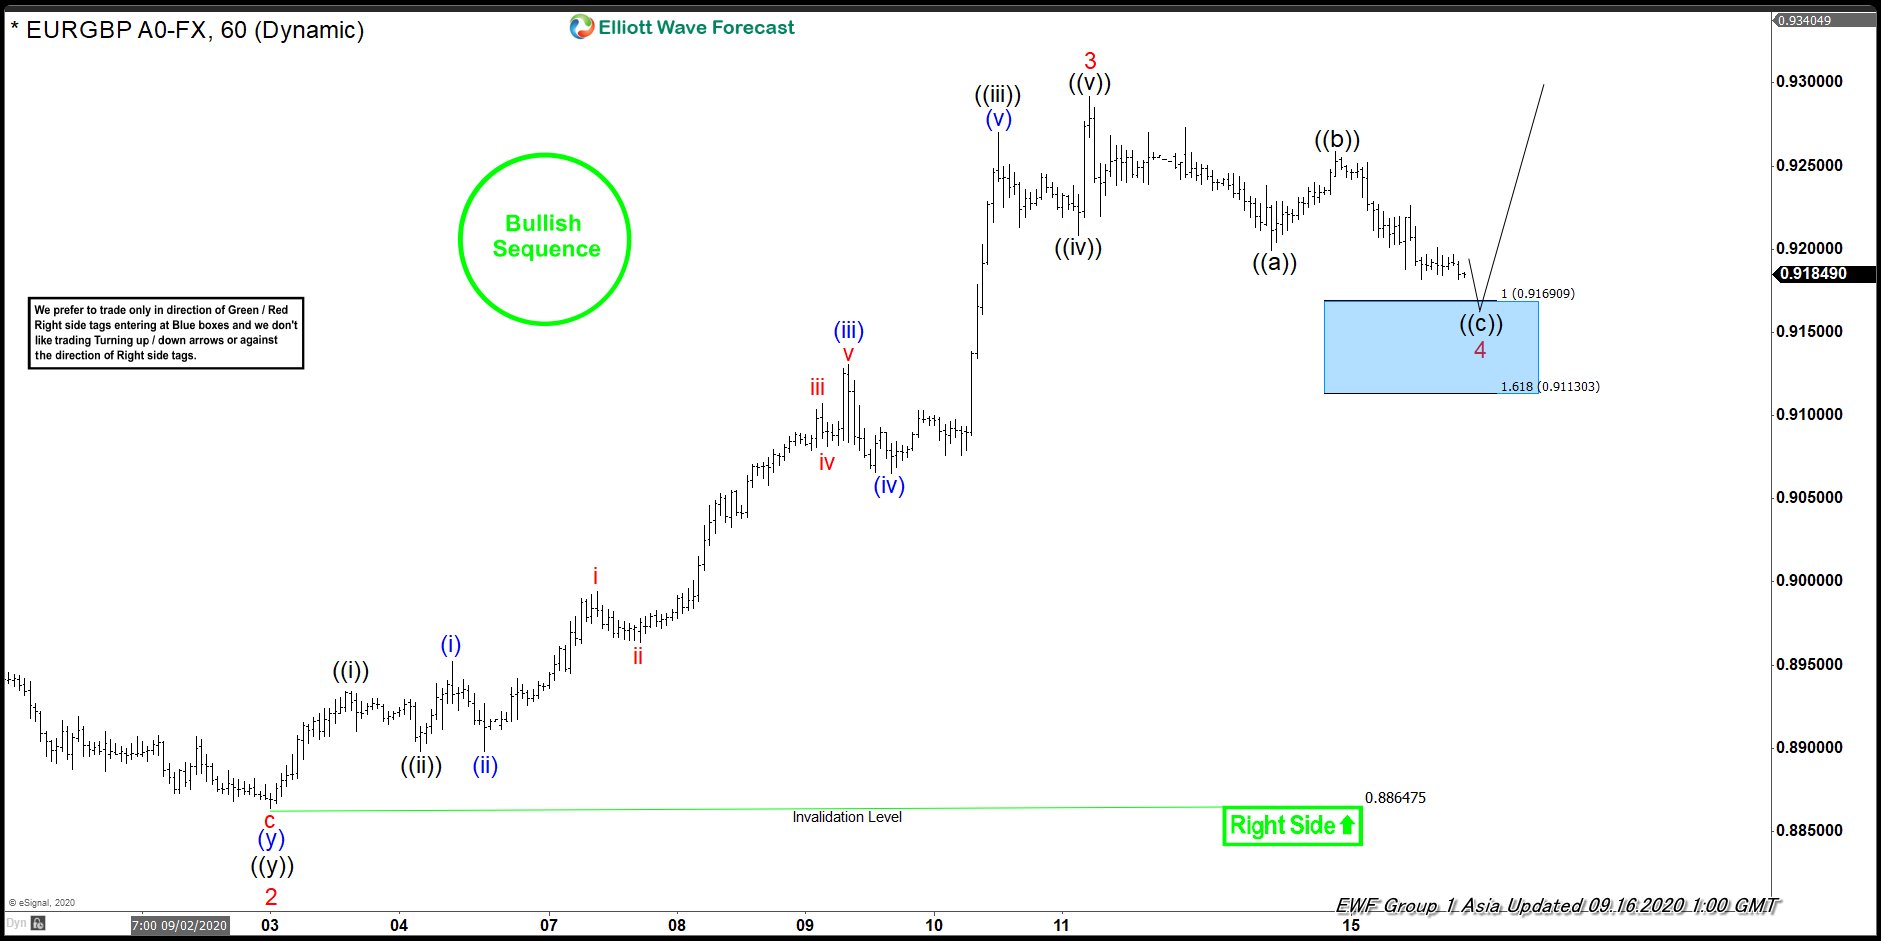
Elliott Wave View of EURGBP suggests that pair shows bullish sequence from April 30 low. Near term, pair has ended the cycle from September 3 low as wave 3 at 0.9291 high. The subdivision of the rally from wave 2 low unfolded as 5 waves impulse Elliott Wave structure. Up from wave 2 low, wave ((i)) ended at 0.8934 high. Wave ((ii)) pullback ended at 0.8898 low. Pair then resumed higher in wave ((iii)), which ended at 0.9270 high. The pullback in wave ((iv)) ended at 0.9208 low. Finally, wave ((v)) resumed higher and ended at 0.9291 high. This final move completed wave 3 in higher degree.
Currently, pair is correcting the cycle within wave 4. The correction is unfolding as a zigzag correction. Down from wave 3 high, wave ((a)) ended at 0.9199 low. The bounce in wave ((b)) ended at 0.9259 high. Wave ((c)) lower is in progress. The 100 – 161.8% extension of wave ((a))-((b)) where wave ((c)) can potentially end is at 0.9113-0.9169 area. This area is shown with a blue box. If reached, pair could resume higher or see a 3 waves bounce at least from that blue box area. The pair then needs to break above wave 3 high to confirm that next leg higher has started. Otherwise, 7 swings double correction can still happen in wave 4.


