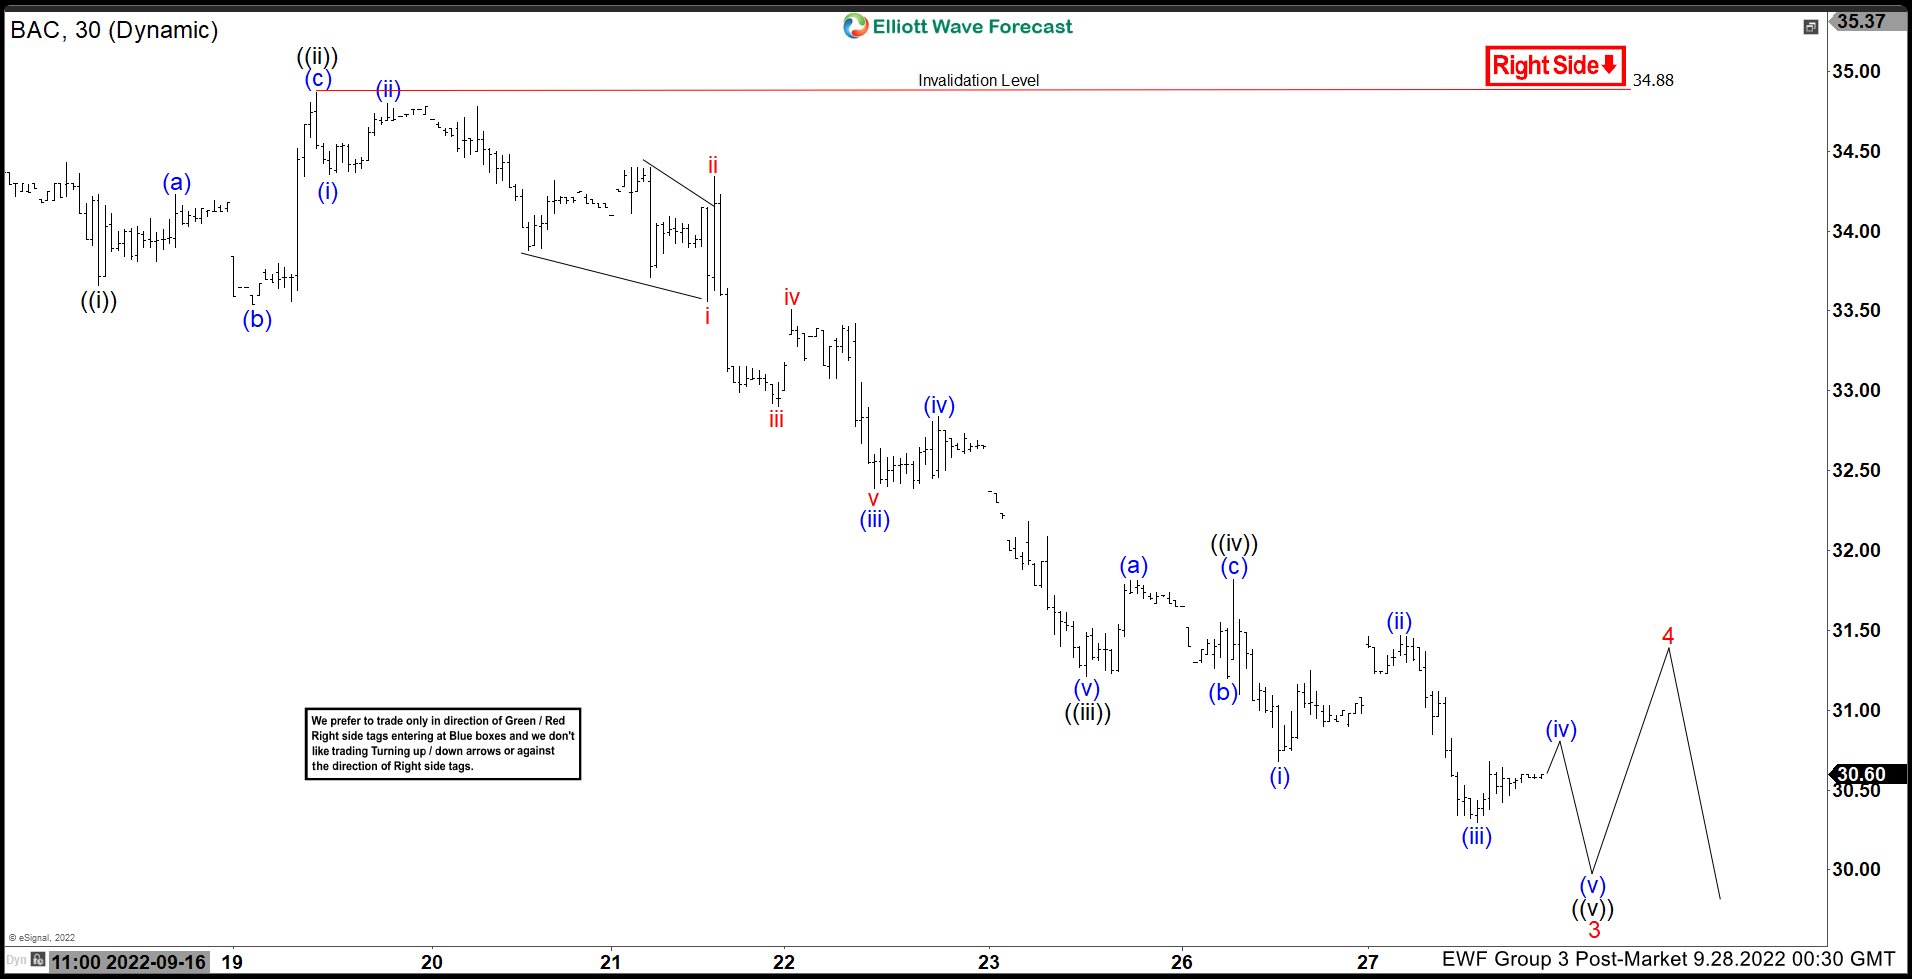
Short term Elliott Wave view on Bank of America (BAC) shows that cycle from 9.12.2022 high is unfolding as a 5 waves impulse Elliott Wave structure. Down from 9.12.2022 high, wave 1 ended at 33.54 and rally in wave 2 ended at 34.90. The stock has resumed lower in wave 3. Down from wave 2, wave ((i)) ended at 33.66 and rally in wave ((ii)) ended at 34.87. The stock resumes lower in wave ((iii)) towards 31.21, and rally in wave ((iv)) ended at 31.82.
Expect the stock to extend lower 1 more leg in wave ((v)) to complete wave 3, then it should rally in wave 4 before it resumes lower again. The stock is now close to breaking below the previous low on 7.14.2022 low (29.67). A break below 7.14.2022 should open up a bearish sequence from 2.10.2022 high calling for further downside. Other broader Index such as Dow Futures ($YM_F) and S&P 500 ($SPX) already broke the same equivalent low, thus it’s likely that BAC should do the same. Near term, as far as pivot at 34.88 high stays intact, expect rally to fail in 3, 7, or 11 swing for further downside.


