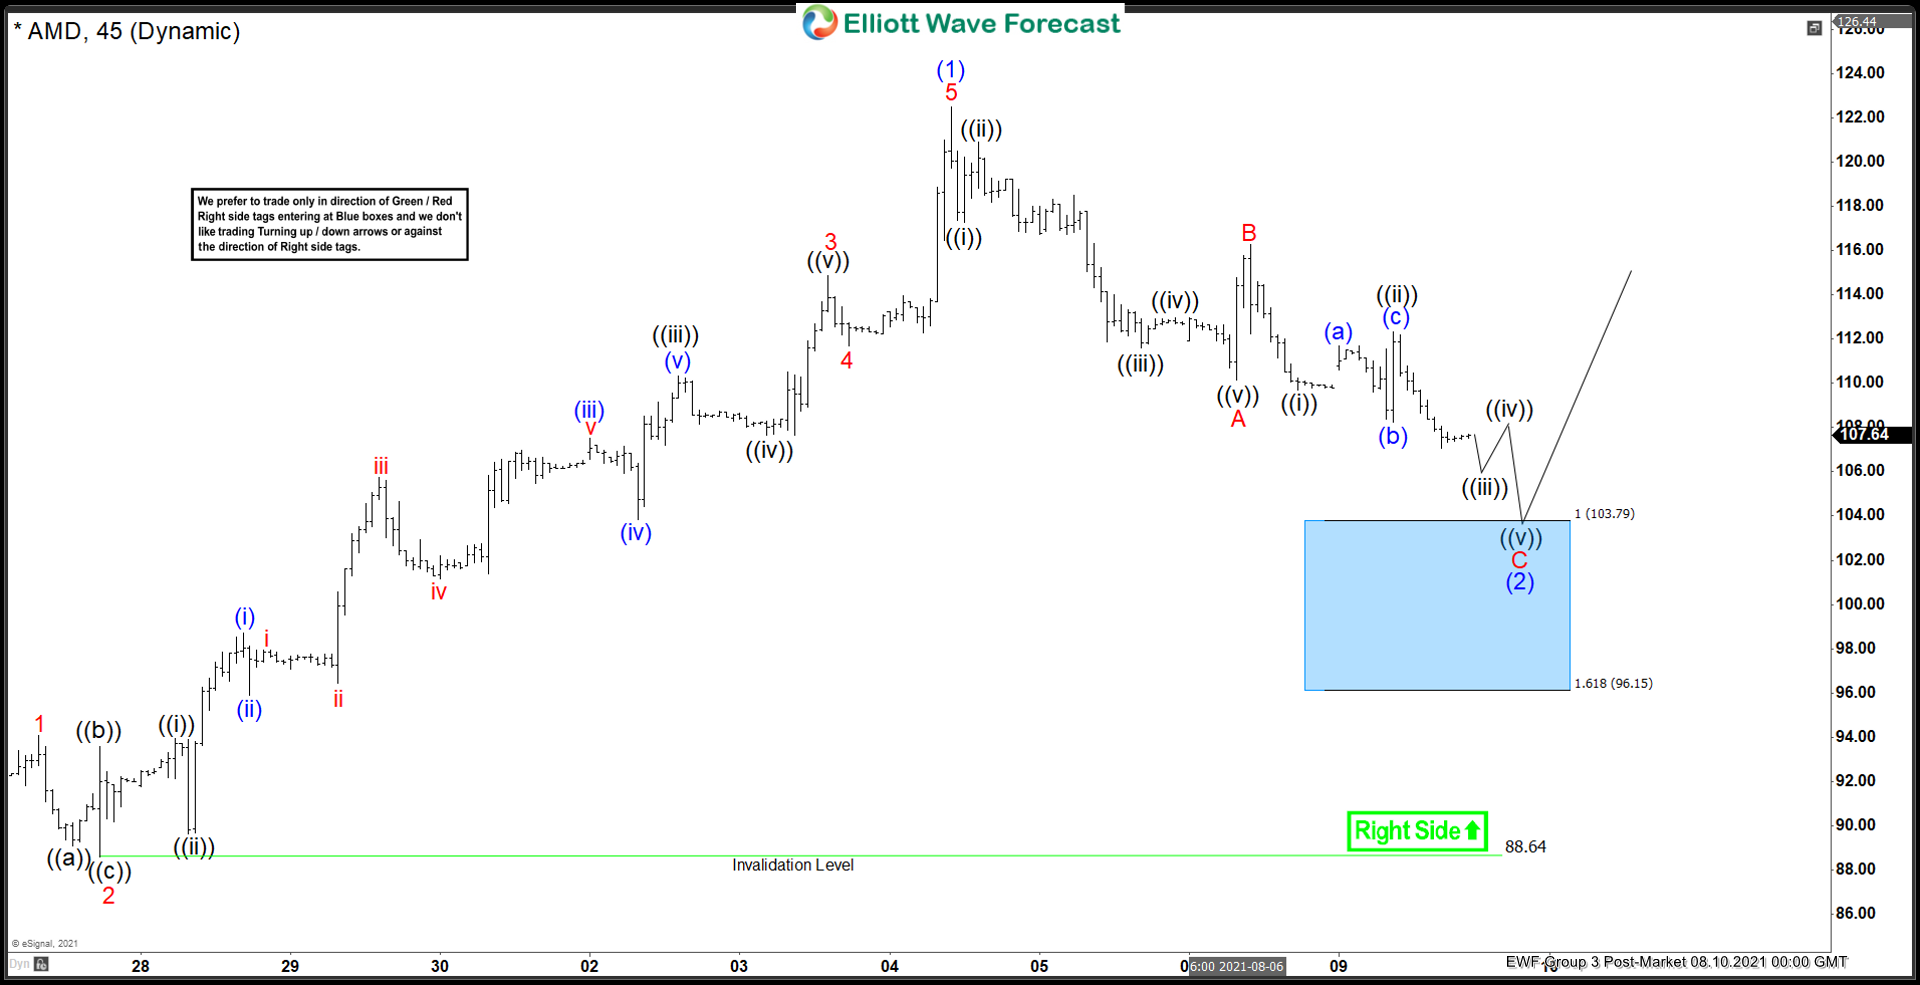
Short Term Elliott Wave view in AMD suggests the rally from July 19 low (84.3) unfolded as a 5 waves impulse Elliott Wave structure. Up from July 19 low, wave 1 ended at 94.1 and pullback in wave 2 ended at 88.61. The Index resumes higher in wave 3 towards 114.85, and pullback in wave 4 ended at 111.57. It then rallied 1 more leg finishing wave 5 at 122.49. This completed wave (1) in higher degree. Wave (2) pullback is now in progress as a zigzag structure.
Down from wave (1), the first leg of the zigzag wave A unfolded as a 5 waves. Wave ((i)) ended at 117.27, rally in wave ((ii)) ended at 120.89. The stock then resumed lower in wave ((iii)) towards 111.59, wave ((iv)) ended at 112.98, and wave ((v)) of A ended at 110.15. Corrective rally in wave B has also ended at 116.26. Wave C is now in progress towards 96.15 – 103.79 which is the 100% – 161.8% Fibonacci extension of wave A. From here, wave C of (2) should end and buyers should appear for more upside or 3 waves rally at least. As far as pivot at 88.64 low remains intact, expect pullback to find support in 3, 7, or 11 swing for further upside.


