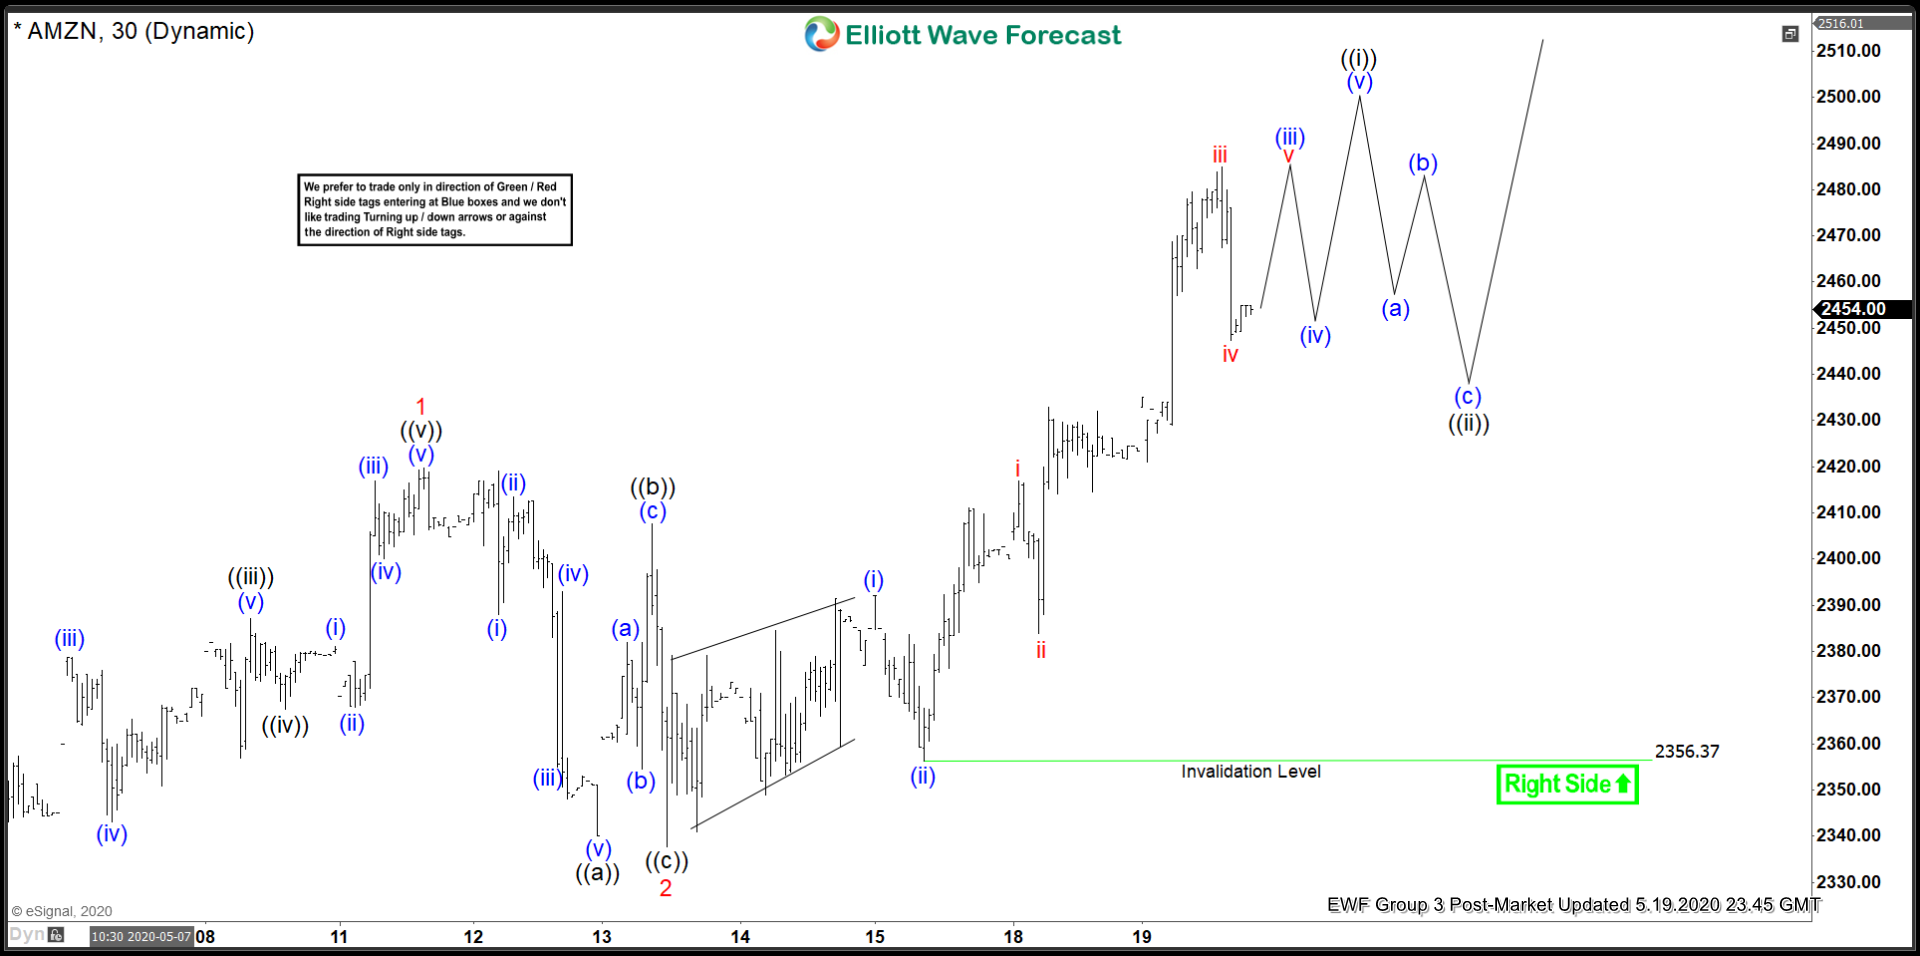
Amazon stock (ticker: AMZN) continues to perform well as the demand of the service surges due to the Covid-19. The pandemic forces people to stay at home and buy a lot of things online, which is precisely the strength of Amazon. Technically, Elliott Wave view is calling the rally from March 16, 2020 low as a 5 waves impulsive Elliott Wave structure.
The larger context (not shown in the short term chart below) suggests Amazon is trading within wave (5) as from March 16, 2020 low. Up from there, wave (1) ended at 1996 and wave (2) pullback ended at 1800. The stock then resumed higher in wave (3) towards 2475, and wave (4) pullback ended at 2245. Wave (5) remains in progress with internal subdivision as another impulse in lesser degree.
Up from wave (4) at 2245, wave 1 ended at 2419.67 and wave 2 pullback ended at 2337.80. The stock can see a few more highs before ending wave ((i)) of 3. Afterwards, it should pullback in wave ((ii)) of 3 before the rally resumes. Short term, as far as pivot at 2356 low stays intact, expect dips to continue to find support in 3, 7, or 11 swing for further upside.


