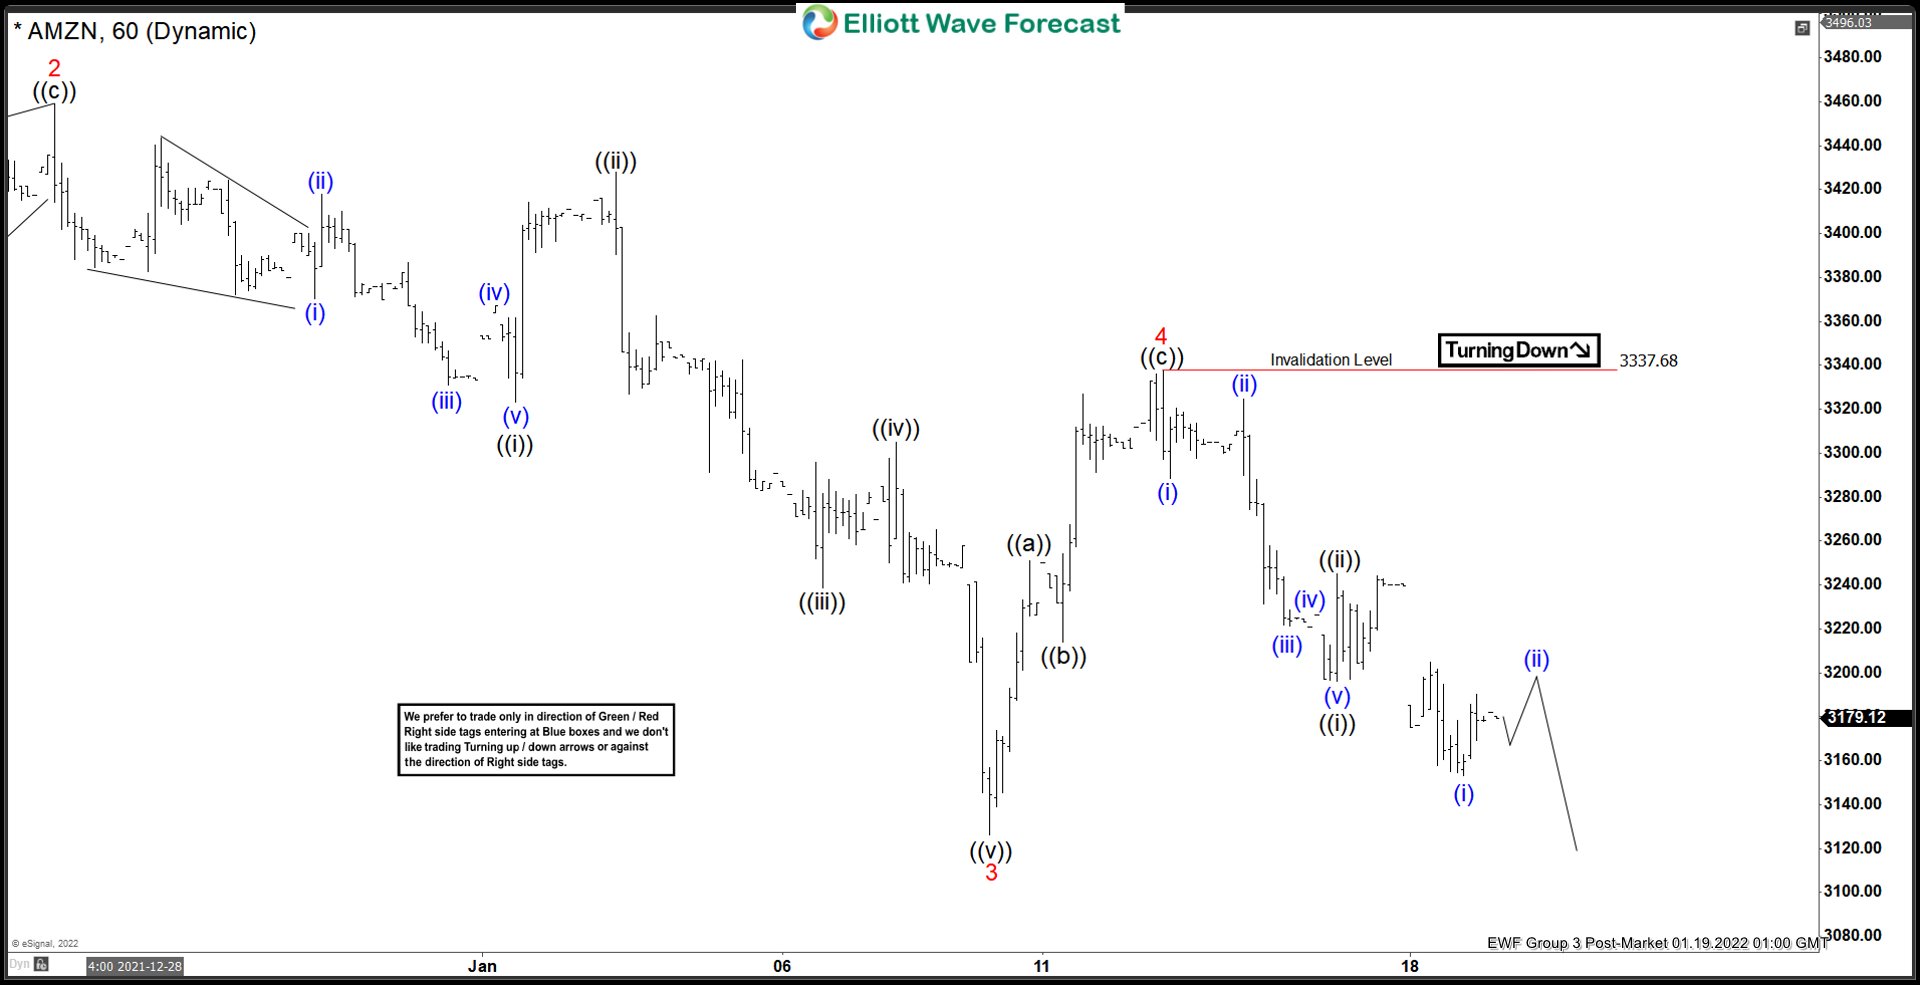
Short Term Elliott Wave view suggests decline from November 19, 2021 peak is unfolding as a 5 waves impulse Elliott Wave structure. Down from November 19 peak, wave 1 ended at 3303.90 and rally in wave 2 ended at 3458.86. The stock then extends lower in wave 3 towards 3126.09 with internal subdivision of an impulse in lesser degree as the 60 minutes chart below shows. Down from wave 2, wave ((i)) ended at 3323.21 and wave ((ii)) ended at 3428. Wave ((iii)) ended at 3238.74, wave ((iv)) ended at 3304.86, and wave ((v)) ended at 3145.63 which also completed wave 3.
Rally in wave 4 ended at 3337.68 with internal subdivision as a zigzag structure. Up from wave 3, wave ((a)) ended at 3251.08, wave ((b)) ended at 3232, and wave ((c)) of 4 ended at 3337.68. Stock has resumed lower in wave 5 which should subdivide in 5 waves. The stock still needs to break below wave 3 to validate the view and rule out a double correction. Down from wave 4, wave ((i)) ended at 3196.01 and rally in wave ((ii)) ended at 3245. Near term, as far as pivot at 3337.68 high stays intact, expect rally to fail in 3, 7, or 11 swing for further downside.


