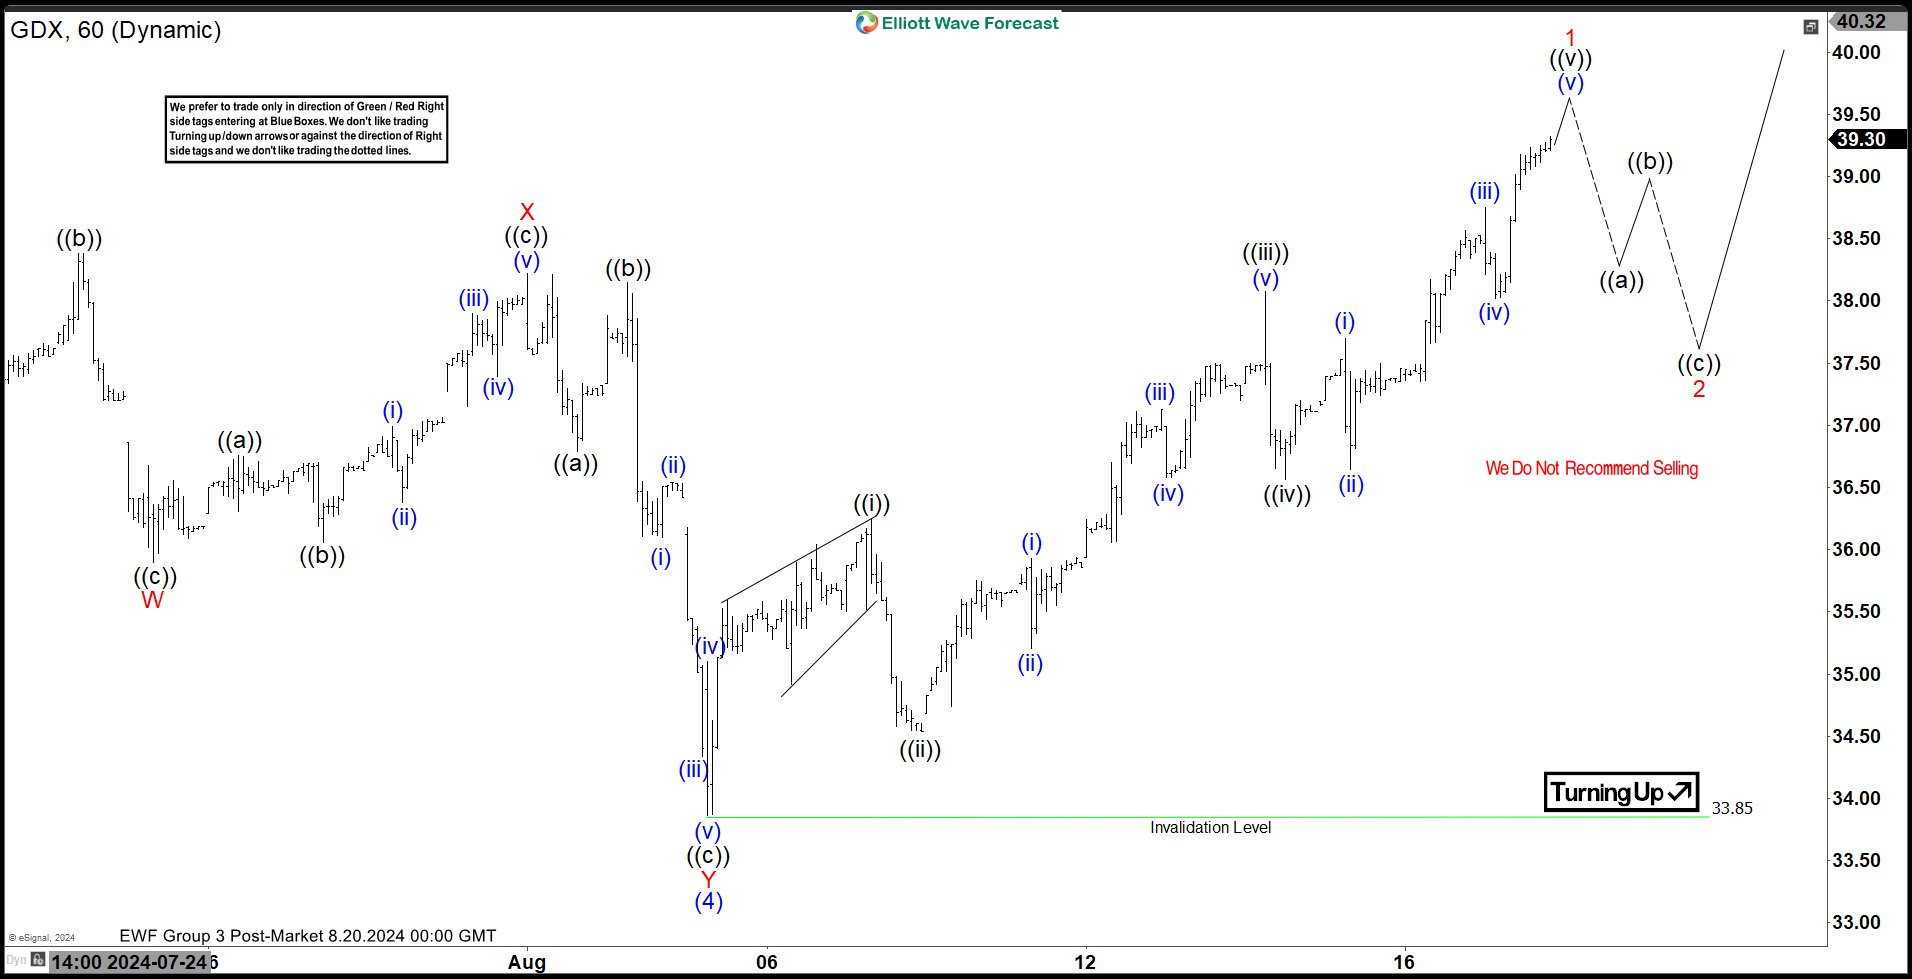
Rally from 9.26.2022 low in $GDX is currently in progress as a 5 waves diagonal. Up from 9.26.2022 low, wave (1) ended at 36.26 and pullback in wave (2) ended at 25.62. The ETF then extended higher in wave (3) towards 39.4 and pullback in wave (4) ended at 33.85 as the 1 hour chart below shows. Internal subdivision of wave (4) unfolded as a double three Elliott Wave structure. Down from wave (3), wave W ended at 35.9 and wave X ended at 38.22. Wave Y lower ended at 33.85 which completed wave (4) in higher degree.
The ETF then turns higher again in wave (5). Up from wave (4), wave ((i)) ended at 36.25 and wave ((ii)) pullback ended at 34.54. Wave ((iii)) higher ended at 38.08 and pullback in wave ((iv)) ended at 36.56. Expect wave ((v)) to complete soon which should also end wave 1 in higher degree. Afterwards, it should pullback in wave 2 to correct cycle from 8.5.2024 low in 3, 7, or 11 swing before the ETF resumes higher again. Near term, expect pullback to find support in 3, 7, 11 swing against 33.85 for further upside.


