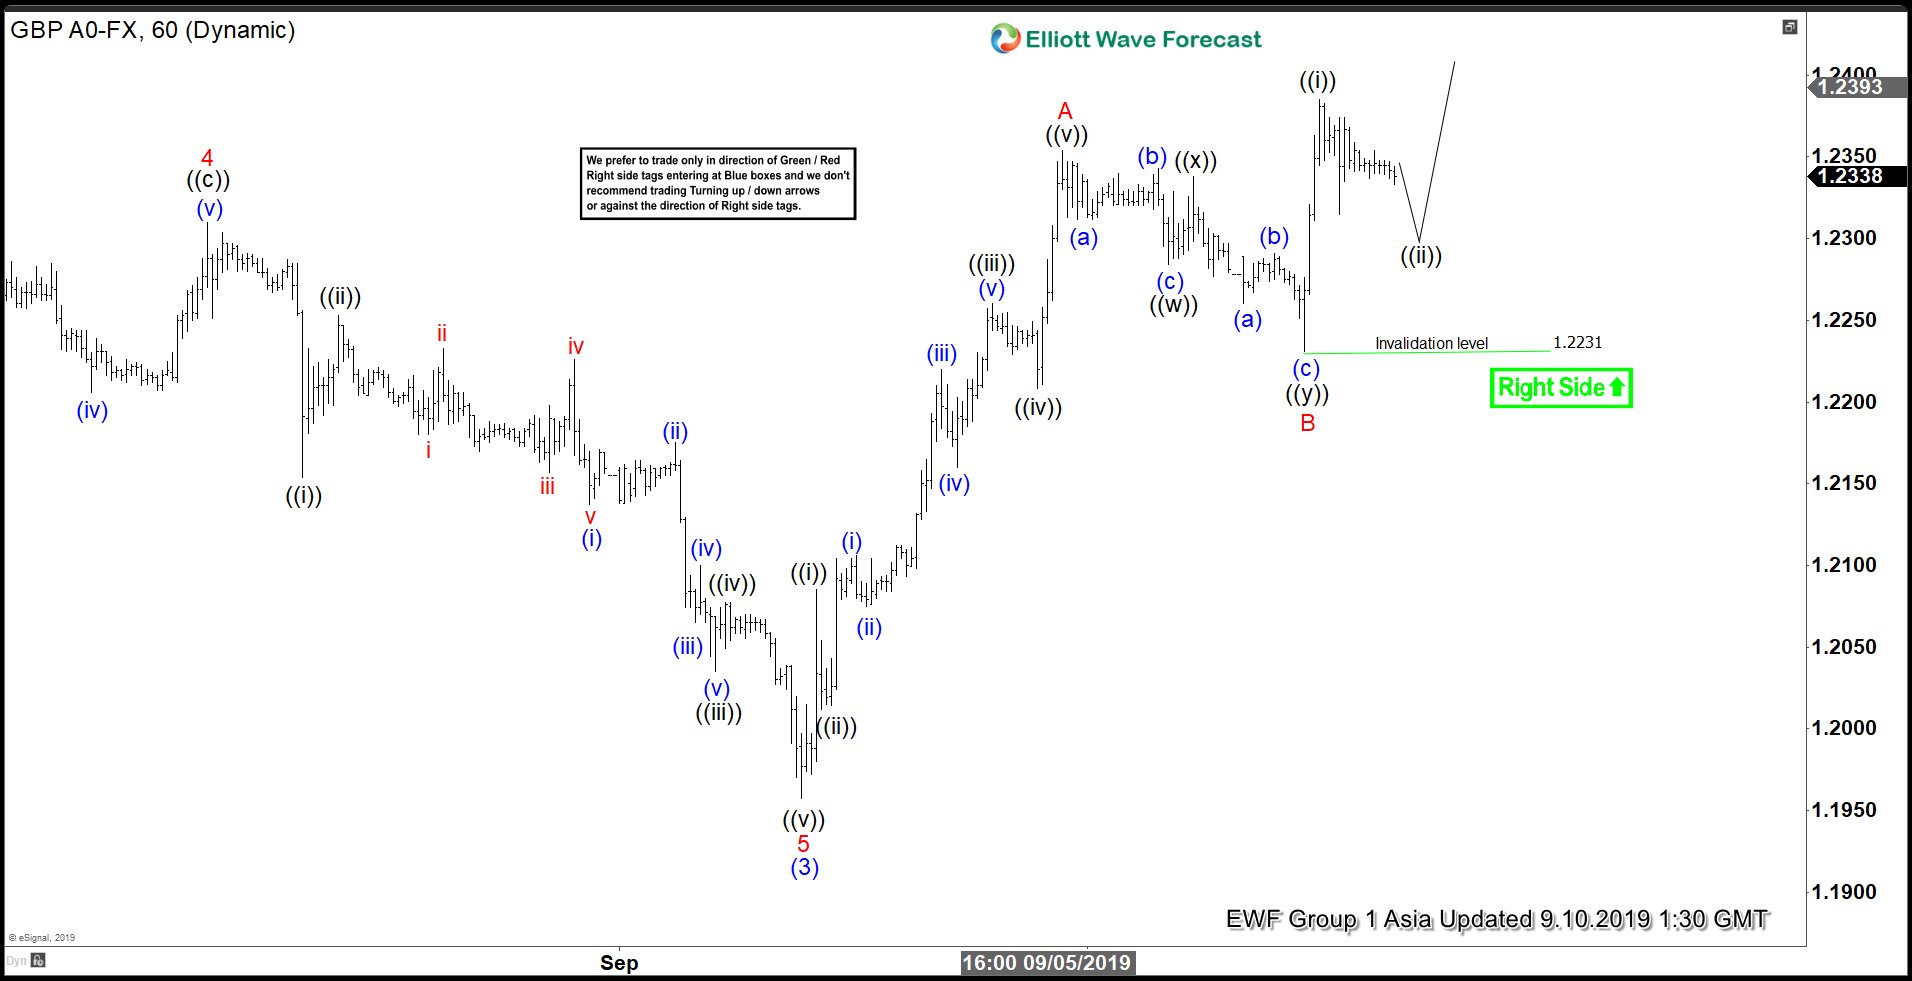
Short term Elliott Wave view in GBPUSD suggests that the decline to 1.1957 on September 3 ended wave (3). Wave (4) bounce is in progress as a zigzag Elliott Wave structure. Up from 1.1957, wave A ended at 1.235 and subdivides as a 5 waves impulse. Wave ((i)) of A ended at 1.2085, wave ((ii)) of A ended at 1.2012, wave ((iii)) of A ended at 1.226, wave ((iv)) of A ended at 1.22, and wave ((v)) of A ended at 1.235.
Pair then corrected the rally from 1.1957 low in wave B. Wave B unfolded as a double zigzag corrective structure and completed at 1.223. Wave ((w)) of B ended at 1.2284, wave ((x)) of B ended at 1.2338, and wave ((y)) of B ended at 1.223. Pair has since resumed higher and broken above wave A at 1.235 suggesting the next leg higher has started. Near term, while pullback stays above 1.223, expect pair to extend higher within wave C of (4). Potential target for wave C can be as high as wave A which comes at 1.262 – 1.287. The area, if reached, should see sellers for 3 waves pullback at least.


