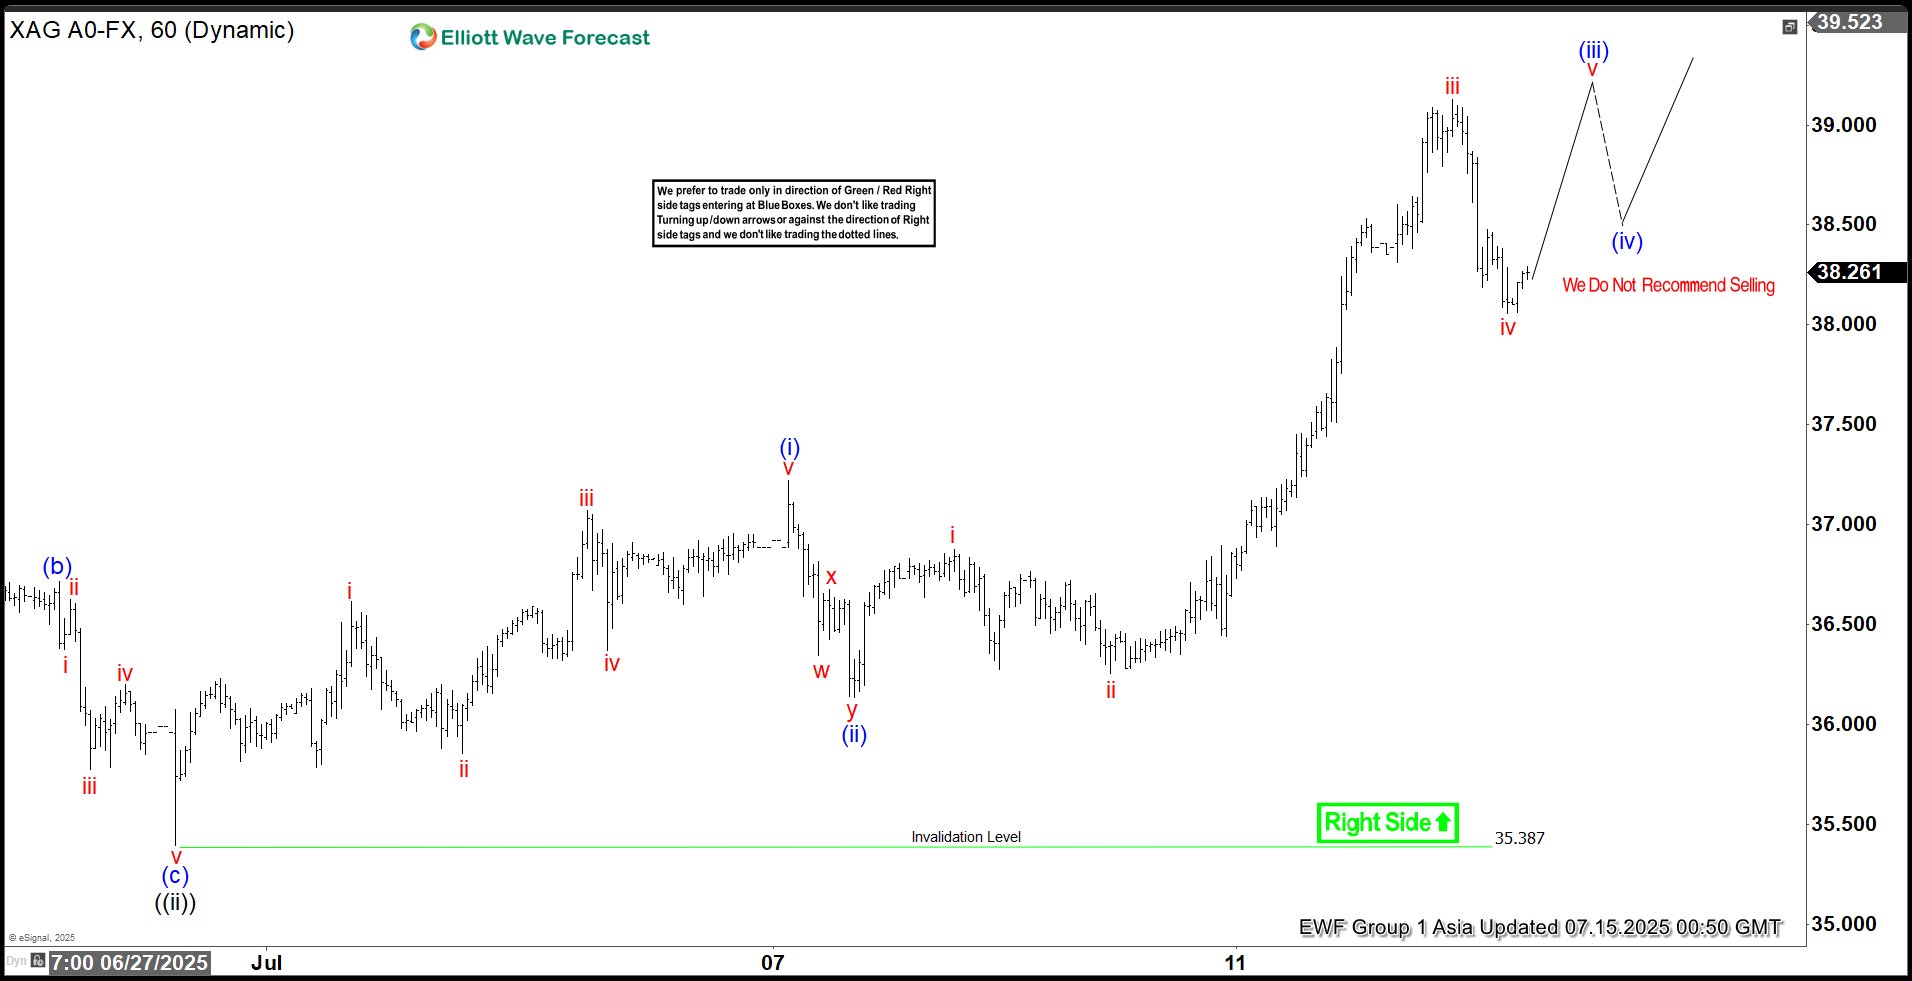
The cycle from the June 24, 2025 low in Silver (XAGUSD) is unfolding as a five-wave rally with an extended nested impulse structure. From the June 24 low, wave ((i)) peaked at $36.83. Wave ((ii)) pullback then followed o $35.39, as shown on the 1-hour chart. The metal then extended higher in wave ((iii)), subdivided as an impulse. From wave ((ii)), wave i ended at $36.61, with a wave ii pullback to $35.86. Wave iii reached $37.07 and wave iv corrected to $36.37. The final wave v concluded at $37.22, completing wave (i) in a higher degree.
The subsequent wave (ii) pullback ended at $36.14, structured as a double-three pattern. From wave (i), wave w declined to $36.34 and wave x recovered to $36.67. Wave y fell to $36.14, finalizing wave (ii). Silver then resumed its ascent in wave (iii). From wave (ii), wave i peaked at $36.87, wave ii corrected to $36.25, wave iii surged to $39.12, and wave iv pulled back to $38.05. The metal is expected to complete one more leg higher in wave v, concluding wave (iii) in a higher degree. A wave (iv) pullback should follow before the rally resumes.In the near term, as long as the pivot low at $35.38 holds, pullbacks are expected to find buyers in a 3, 7, or 11-swing sequence, supporting further upside in Silver.
Silver (XAGUSD) 60-Minute Elliott Wave Technical Chart


