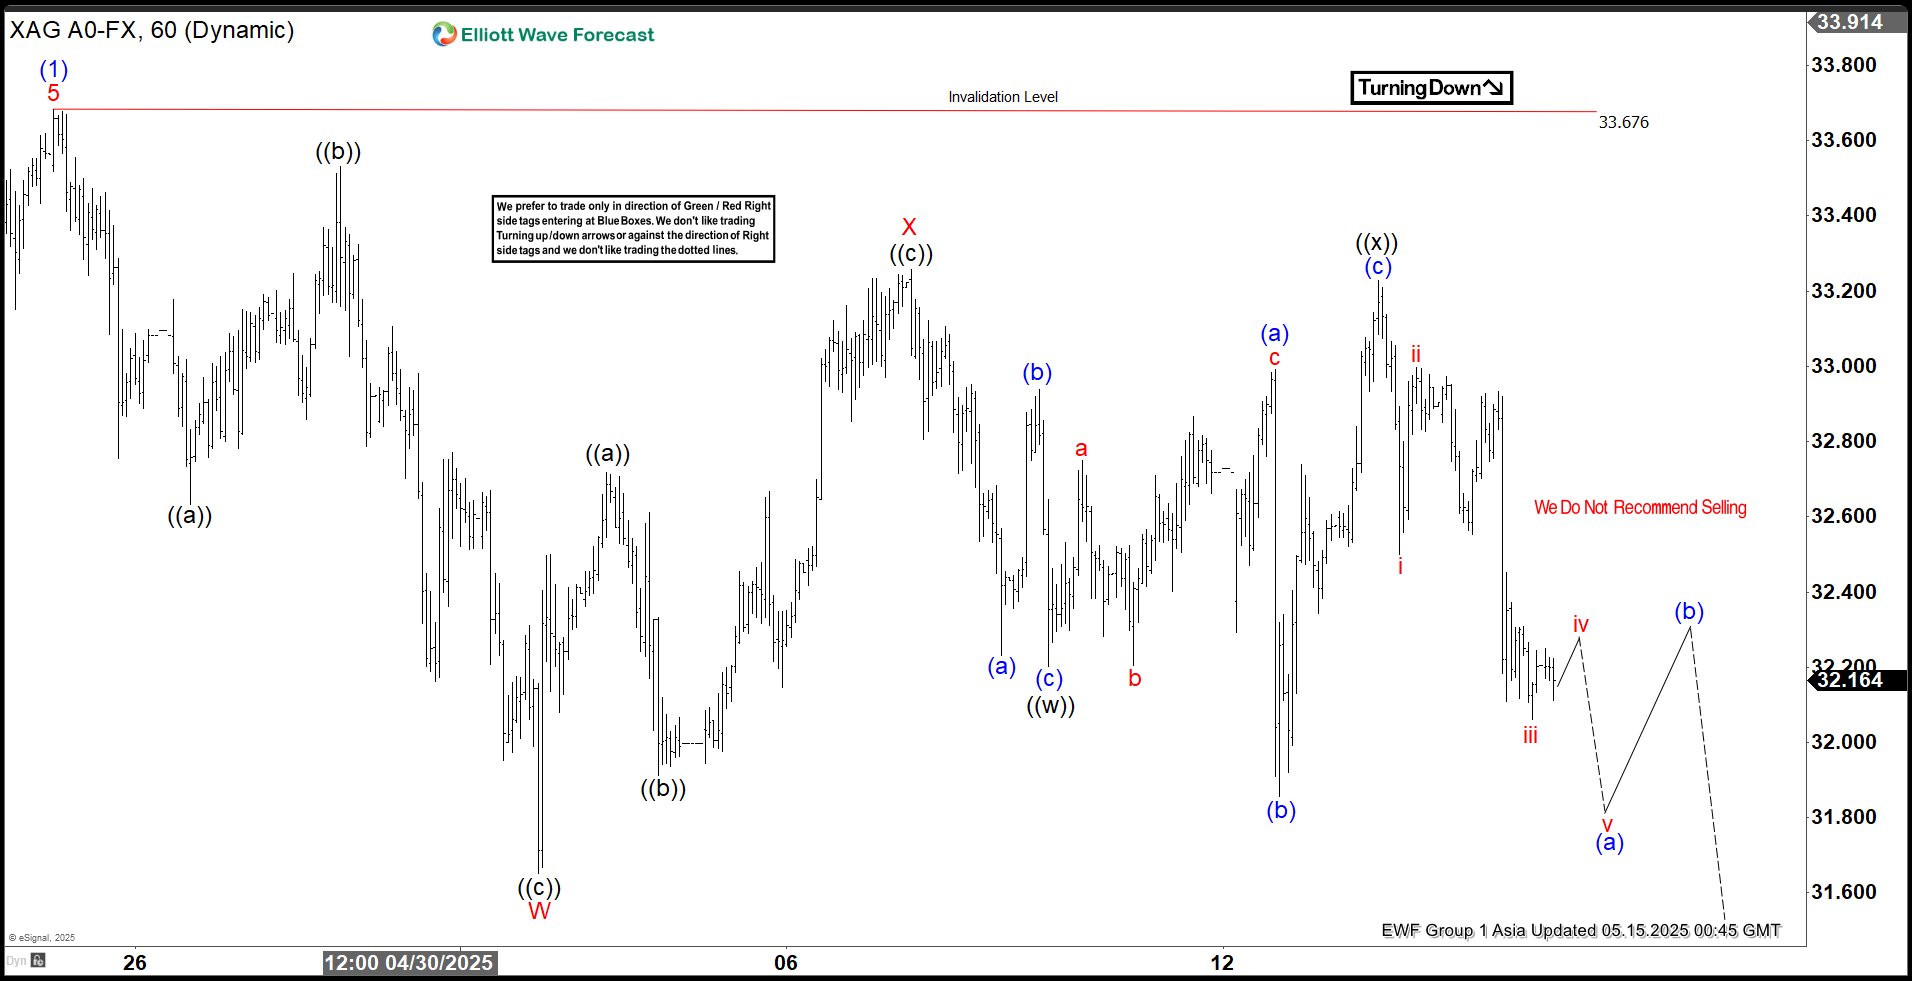
Silver’s rally from its April 7, 2025, low has unfolded as an impulsive Elliott Wave structure, completing Wave (1) at $33.67. The metal is now in a corrective Wave (2) pullback. It is characterized by a double three Elliott Wave pattern, a common corrective formation in technical analysis. From the Wave (1) peak, Wave ((a)) declined to $32.63, followed by a recovery in Wave ((b)) to $33.53. The subsequent drop in Wave ((c)) reached $31.65, finalizing Wave W of the double three structure.
A corrective rally then formed Wave X, structured as a zigzag. Within Wave X, Wave ((a)) advanced to $32.70, Wave ((b)) pulled back to $31.91, and Wave ((c)) rose to $33.25, completing Wave X at a higher degree. Silver has since resumed its decline in Wave Y. From the Wave X high, Wave ((w)) fell to $32.20, and a minor recovery in Wave ((x)) hit $33.23. As long as Silver stays below the Wave (1) high of $33.67, further downside is expected, targeting $29.90–$31.18, based on the 100%–161.8% Fibonacci extension from the April 25, 2025, high. This range may attract buyers, potentially sparking a reversal. While the $33.67 pivot holds, rallies are likely to fail in 3, 7, or 11-swing patterns, leading to further declines. Traders should watch these levels for strategic entry points.
Silver (XAGUSD) 60-Minute Elliott Wave Technical Chart
Silver hourly chart showing current wave structure with projected targets and critical support


