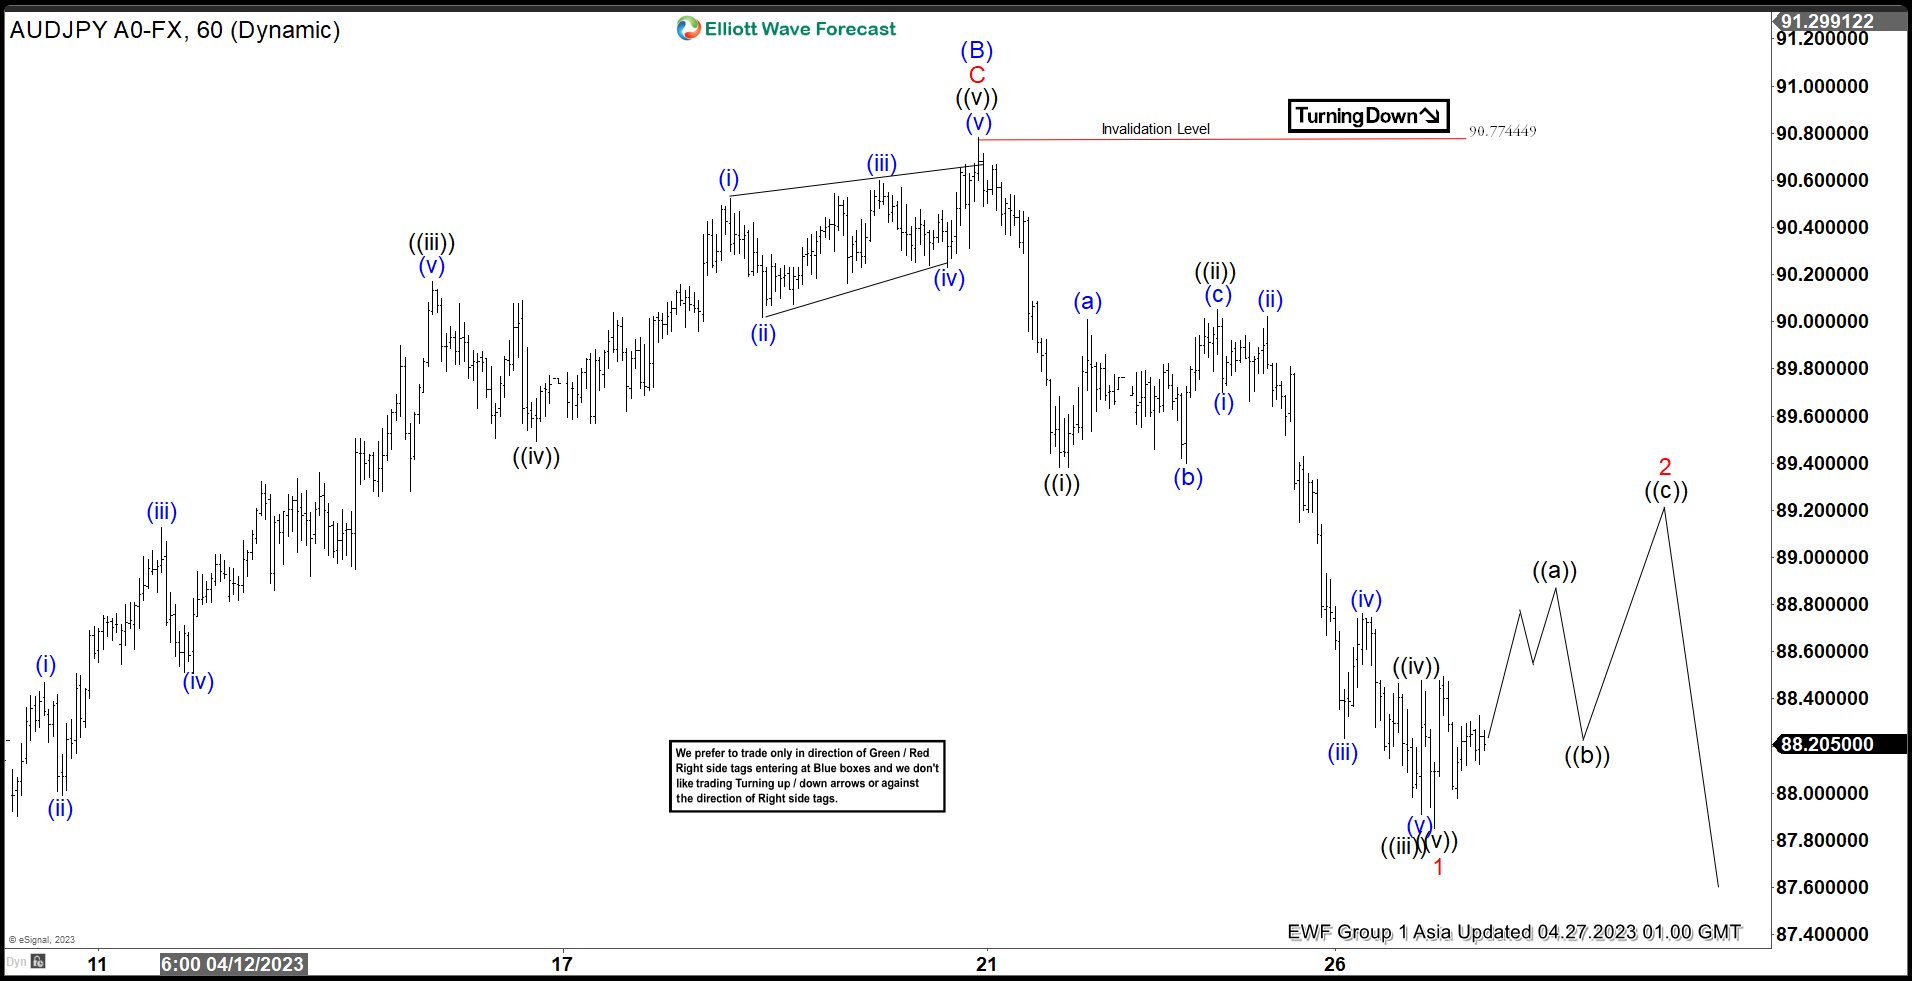
The decline from 9.13.2022 high in $AUDJPY shows a 5 swing Elliott wave sequence suggesting further downside is likely. Near term, rally from 3.24.2023 low ended in 3 swing at 90.77. We labelled the rally as wave (B) as 1 hour chart below shows. Internal subdivision of the rally from 3.24.2023 low unfolded as a zigzag. Up from there, wave A ended at 90.168 and pullback in wave B ended at 87.59. Wave C higher ended at 90.77 which completed wave (B).
Wave (C) lower is now in progress with internal subdivision as a 5 waves. Down from wave (B), wave ((i)) ended at 89.38 and rally in wave ((ii)) ended at 90.05. Down from there, wave (i) ended at 89.7 and rally in wave (ii) ended at 90.02. Pair resumes lower in wave (iii) towards 88.23, and rally in wave (iv) ended at 88.76. Final leg wave (v) ended at 87.91 which completed wave ((iii)). Wave ((iv)) rally ended at 88.478. Final leg wave ((v)) ended at 87.85 which completed wave 1. Wave 2 rally is now in progress to correct cycle from 4.20.2023 high in 3, 7, or 11 swing before the decline resumes. Near term, as far as pivot at 90.77 high stays intact, expect rally to fail in 3, 7, 11 swing for further downside.


