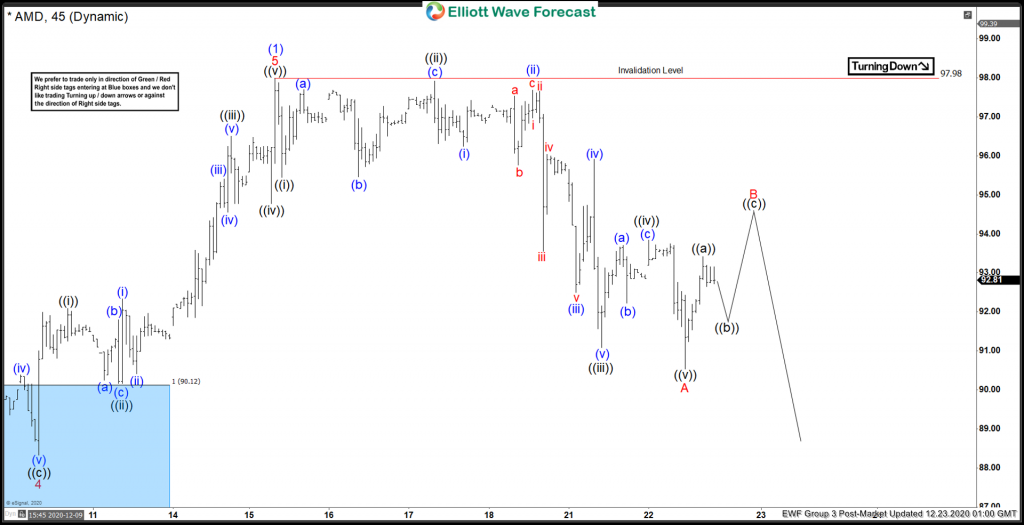
Short term Elliott wave view in Advanced Micro Devices ticker symbol: AMD is showing an impulse rally higher from 02 November 2020 low. And now it’s doing a pullback to correct that cycle in 3 or 7 swings pullback, which we believe should provide another buying opportunity later on when an extreme area is reached. In the 1hr chart below, AMD ended a lesser degree wave 4 at $88.33 low. Up from there, the stock made a 5 waves rally within wave 5 where wave ((i)) ended at a $92.09 high. Wave ((ii)) ended at $90.16 low, wave ((iii)) ended at $96.50. Wave ((iv)) ended at $94.78 low. And wave ((v)) ended at $97.98 high thus completed wave (1).
Down from there, the stock is doing a pullback in wave (2). While the internals of that pullback is unfolding as a zigzag structure where wave ((i)) ended at $95.45 low. Wave ((ii)) ended as a lesser degree flat structure at $97.92 high. Below from there, wave ((iii)) ended at $91.08 low, wave ((iv)) bounce ended at $93.84 high. While wave ((v)) ended at $90.53 low thus completed wave A of zigzag structure. Near-term, as far as the stock remains below $97.98 high then wave B bounce is expected to fail in 3 swings looking for another extension lower in wave C before it gets ready for another buying opportunity.


