USDSEK found a low at 9.2929 on December 31, 2019 and rallied in 5 waves to 9.529. This was followed by a 3 waves pull back to 9.439 on January 15, 2020 and then the pair started trading higher again and managed to break above January 13, 2020 high to create an incomplete sequence higher from December 31, 2019 low. Since initial rally from December 31, 2091 low was in 5 waves, we anticipated the pair to be in a zigzag Elliott Wave structure with more upside to come in wave (C). Let’s take a look at the charts of USDSEK below to see how the move unfolded.
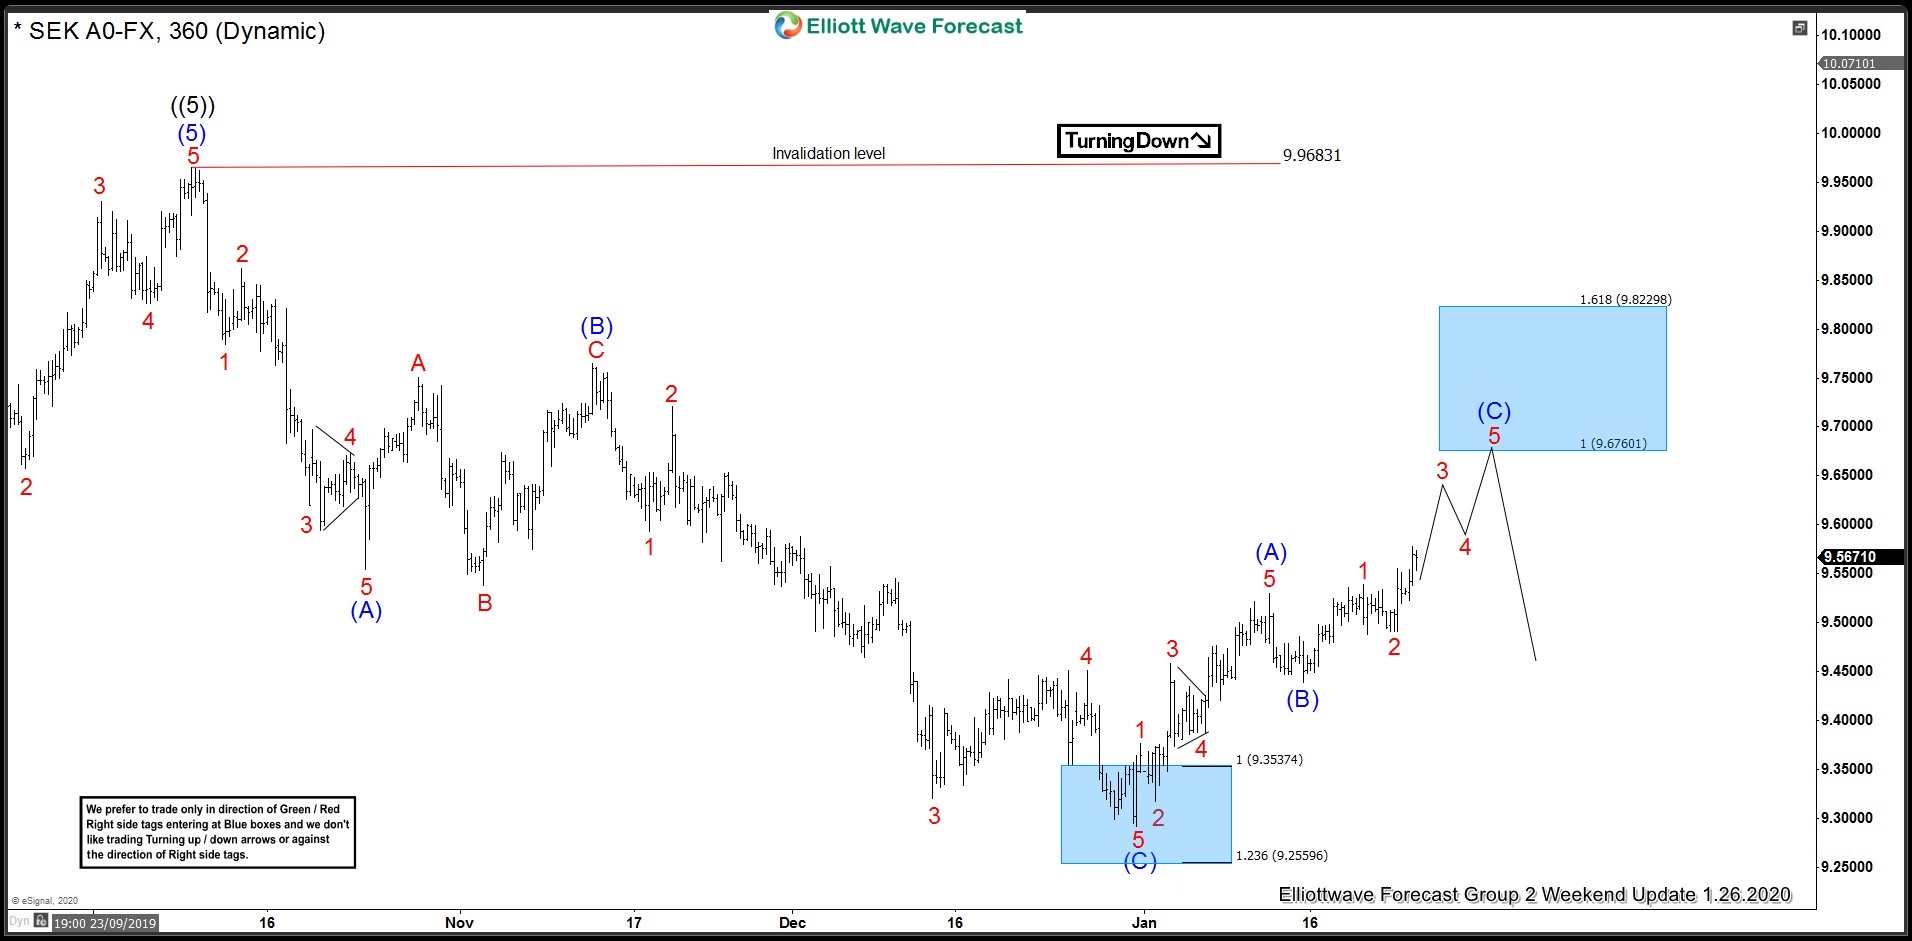
USDSEK 26 January 4 Hour Elliott Wave Update
USDSEK forex pair completed 5 waves rally in wave (A) at 9.529 and completed wave (B) pull back at 9.439. After this pair managed to break above wave (A) peak to complete an incomplete Zigzag structure up from December 31, 2019 low. A Zigzag is an Elliott Wave structure in which both wave A and C unfold in 5 wave and is also called a 5-3-5 structure. You can learn more about Zigzag Elliott wave structure here. Up from wave (B) low, pair completed wave 1 at 9.538 and completed wave 2 at 9.488 and then broke above wave 1 peak (9.538) indication start of wave 3 of (C) higher. Chart below showed the target area for zigzag structure to be between 9.67 – 9.82 which is 100 – 1.618 Fibonacci extension area of wave (A) related to wave (B).
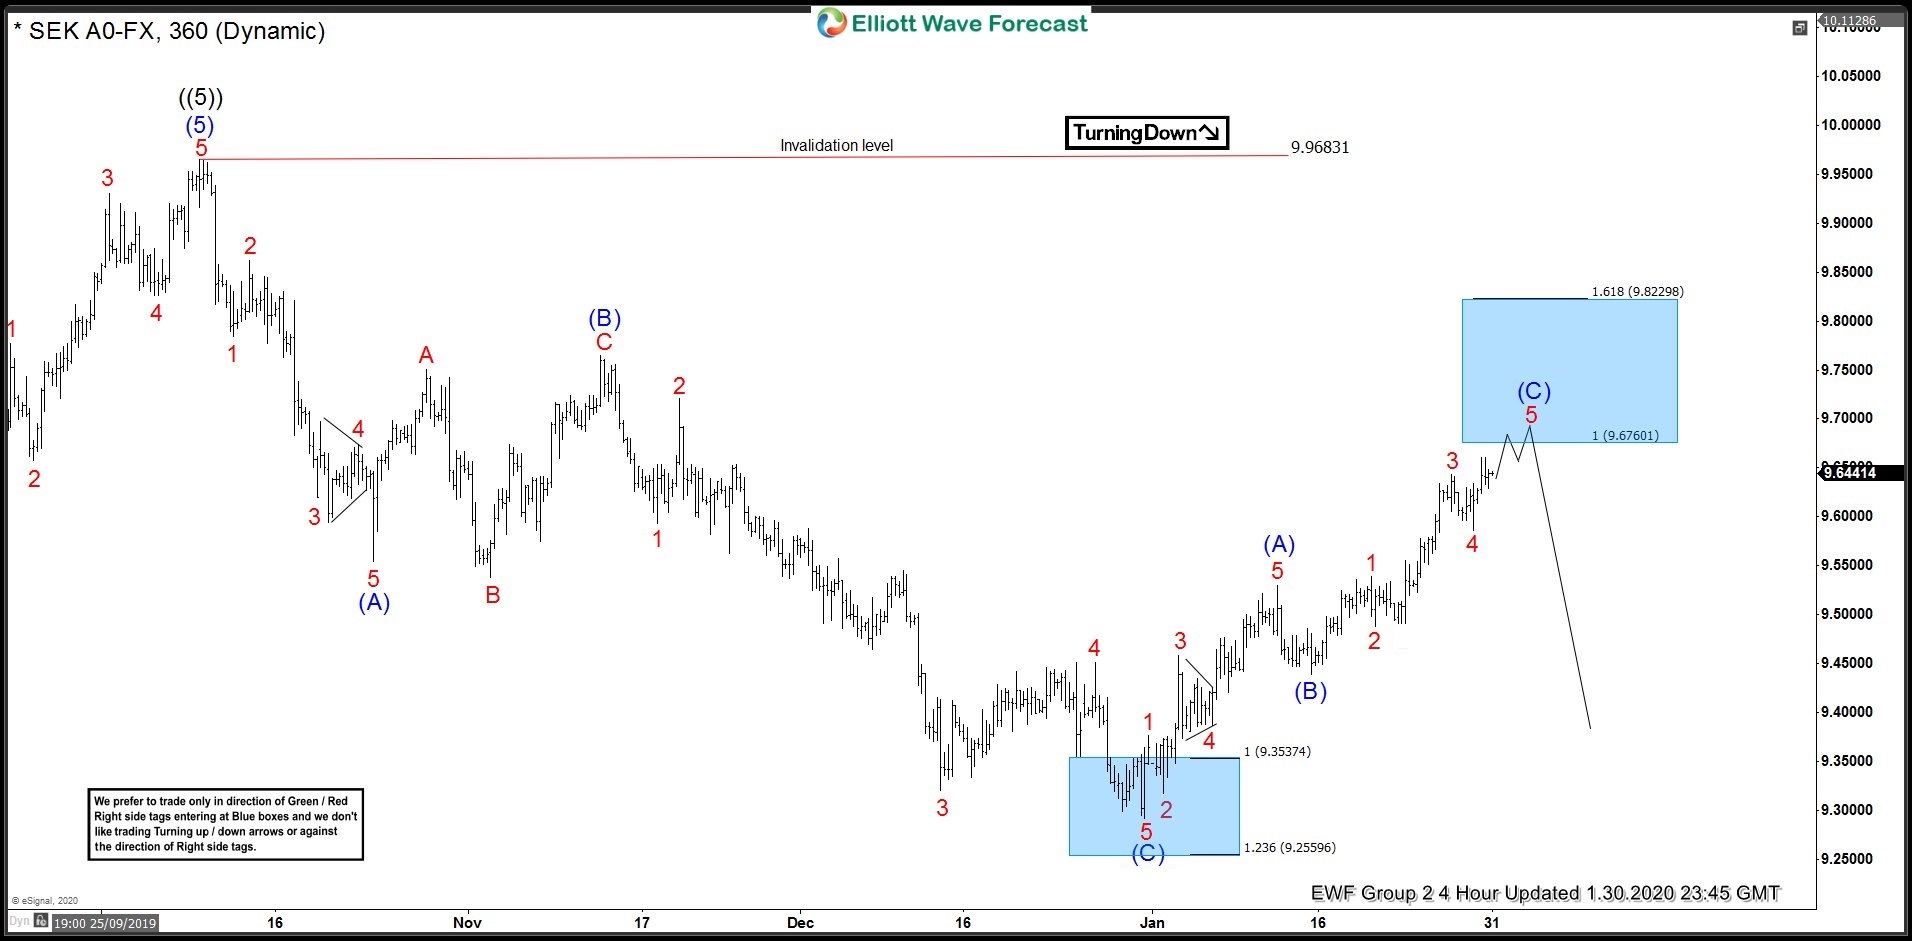
USDSEK 4 Hour Elliott Wave Update 1.30.2020
Chart below shows pair extended the rally in wave 3 as expected. It called wave 3 completed at 9.643 and pull back to 9.586 was labelled as wave 4 and wave 5 higher was shown to be in progress which was expected to hit the blue box area starting from 9.67. As far as price stays below 9.822, the rally from December 2019 low would be a 3 waves move and pair can turn lower to do 7 swings down from 9.968 peak or pull back in 3 waves at least. Break above 9.822 would be an early indication that rally from December 31, 2019 low would become an impulse and the current move higher is a wave (3) rather than wave (C).
Back


