Traders rarely look at the chart of Poland Zloty (USDPLN) and perhaps few even know the existence of the pair. We at Elliottwave-Forecast.com look at a lot of instrument from forex, commodities, and Indices to get an edge in our forecast. The Zloty, along with the Czech crown, is the top performing currency in the world this year. Recent data from Poland such as industrial output, wage and retail sales have painted a picture of robust growth. With strong economic data and limited political risks, this leads to speculation that the Polish central bank may hike the interest rates next year.
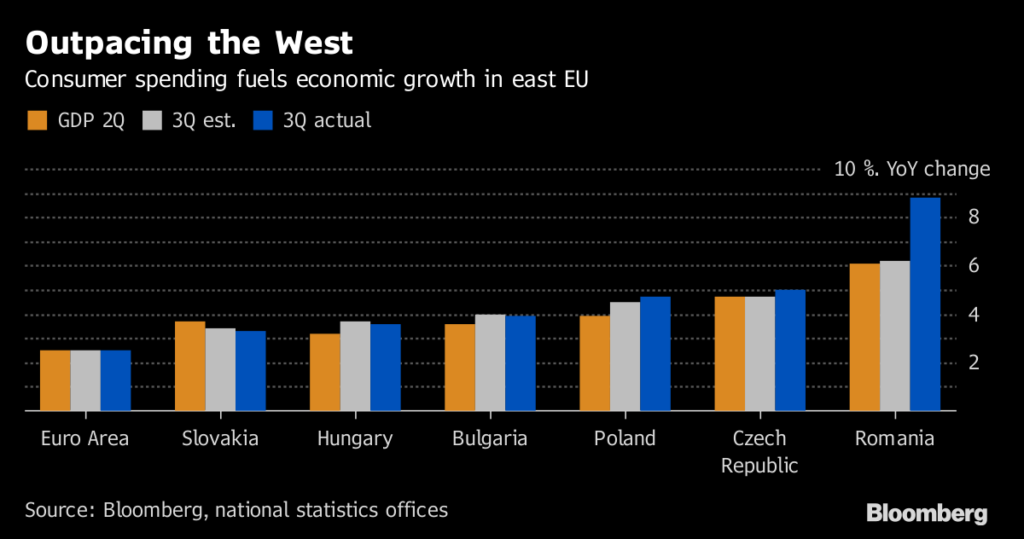
Economic growth in the European Union’s eastern member nations starts to pick up in the third quarter as rising wages propelled consumer spending. The recovery in the Euro Area increased the demand for exports from EU’s Eastern member countries. In addition, loose fiscal policy and record-low unemployment supports consumer spending. The Poland’s economy expanded by 4.7% in the third quarter of this year, which is the fastest since 2011
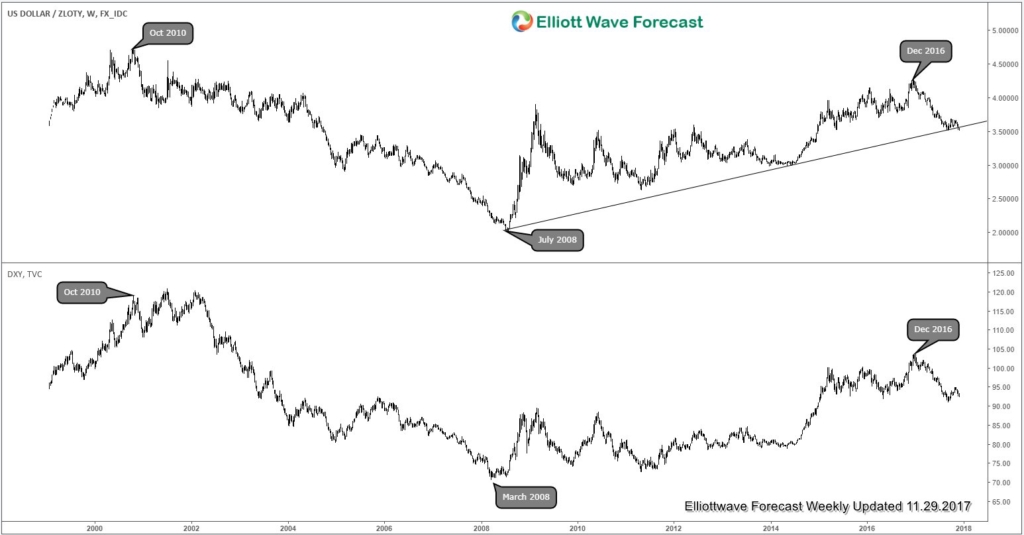
In this article, we will take a look on how USDPLN might be telling us something about the path of U.S. Dollar. First, a weekly overlay of USDPLN and DXY (Dollar Index) below shows a strong positive correlation between the two:
Correlation of USDPLN and DXY
From the chart above, USDPLN (top chart) looks nearly identical to the DXY (bottom chart). Both have almost identical peak and trough around the same period. If one instrument is going down, the other also likely follows, and vice versa. Furthermore, when looking at USDPLN, we can see that the pair looks like it might have broken below the channel support from July 2008 low. If this is really the case, then there’s a possibility that the cycle from July 2008 low has ended and pair thus could see larger correction in 3, 7, or 11 swing to correct that cycle.
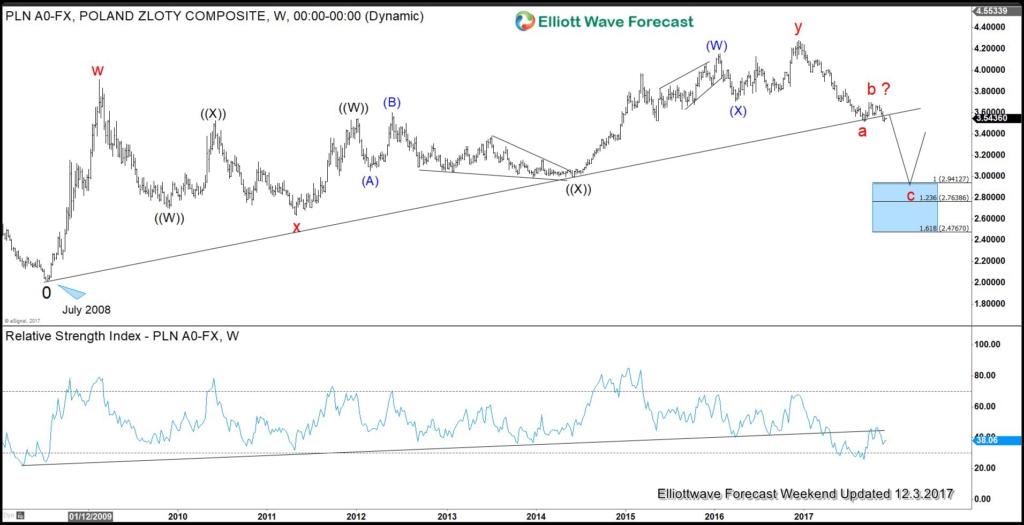
USDPLN Long Term Elliottwave Chart
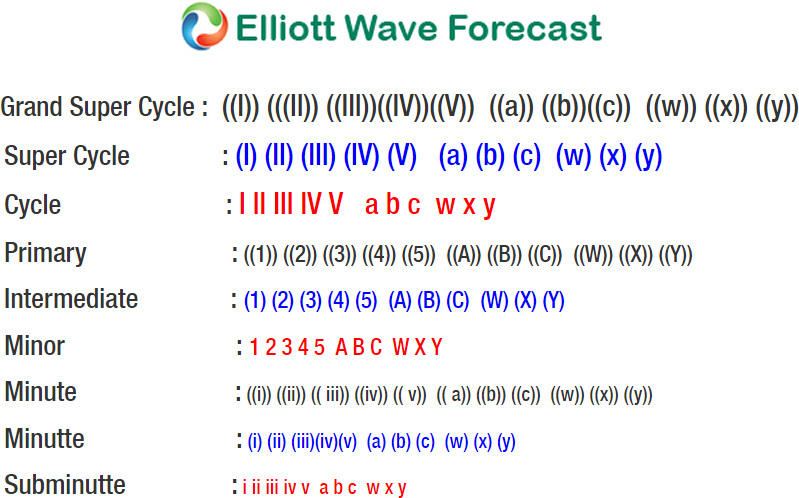
A closer look at the weekly chart of USDPLN above shows that pair has indeed broken below the trend line support from July 2008 low in both price and momentum. This suggests that cycle from 2008 low can be over and pair is in the progress of correcting a larger degree. An interesting observation is whether the latest rally from 3.514 low (wave “a”) to 3.6945 high has ended wave “b” connector. Pair has retested 3.514 low but at the time of this writing, pair has not broken below it. A break below 3.514 may suggest that USDPLN is ready to extend lower in wave “c”. If this is happening, then the Dollar Index may also extend to the downside based on the positive correlation between the two.
With USDPLN looking like it has broken below the ascending trend line from July 2008 low, it does appear as if the pair may indeed extend lower again. For this view to gain validity however, we will need to wait for USDPLN to break below 3.514. Alternatively, the pair can be doing a FLAT in wave “b”. In that case, pair could rally to above 3.6945 before ending wave “b” connector.
If you enjoy this article, check our work and join 14 days Trial to see Elliott Wave Forecast in 4 time frames for 78 instrument as well as getting access to Live Trading Room, Live Session, and more
Back
