Hello traders, in this blog I want to discuss with you a trade setup we advised to our members in our Live Trading Room. It was USDNOK.
Let’s have a quick look at some past Elliott Wave charts of USDNOK we published in our member’s area of www.elliottwave-forecast.com.
Our members know that USDNOK has an incomplete bearish sequence in the 4-hour chart, suggesting further weakness, targeting the areas of 7.1094+ equal legs. For members, it has been very clear how to trade this pair. Selling it in the sequence of 3,7, or 11 Swings. Let’s take a look at the previous short-term Elliott Wave forecasts.
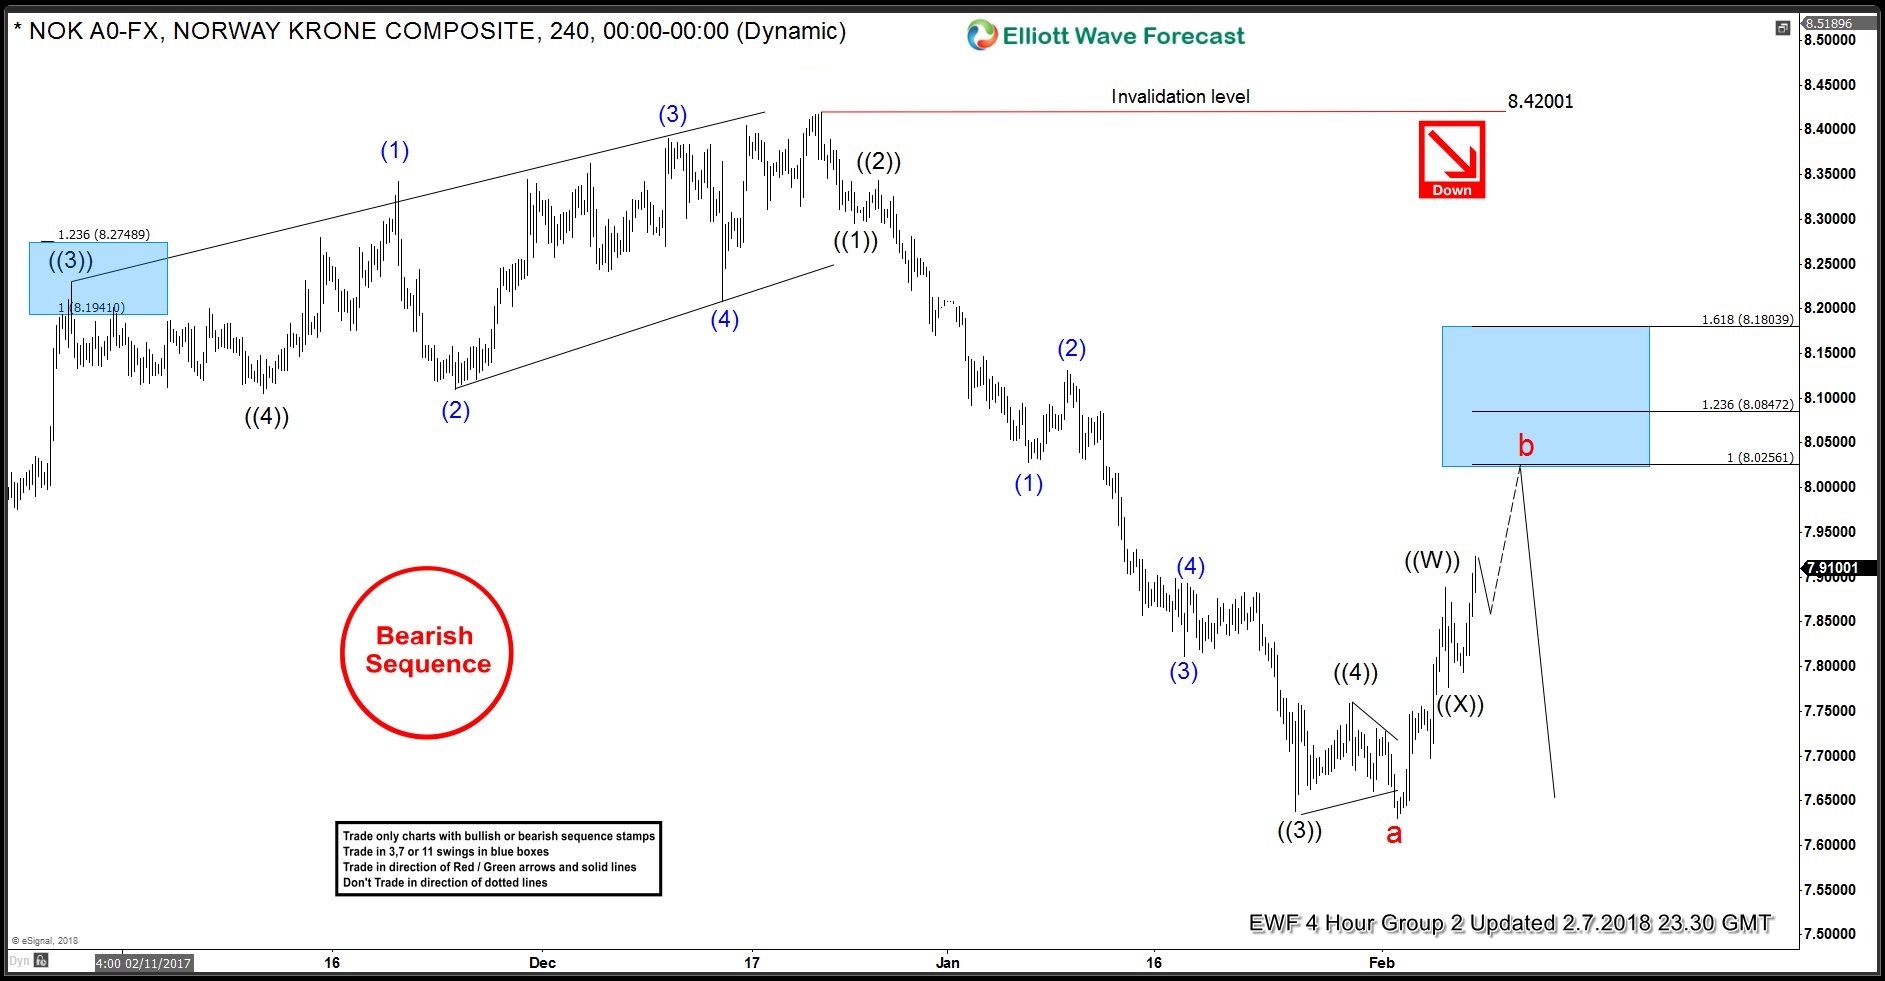
USDNOK 4 Hour Elliott Wave Analysis 2.8.2018
As you can see on the charts below, we have ended the cycle from 12/20/17 peak in red “a” at the recent low. From that low USDNOK has corrected that cycle in a double three Elliottwave structure in black ((W))-((X))-((Y)) degree. Our high-frequency box (Blue box) where between 8.02561-8.1809. That was the area where we proposed our members a selling area. Invalidation of the short trade would be a break above the 1.618 Fibonacci extensions. Which comes at 8.18039.
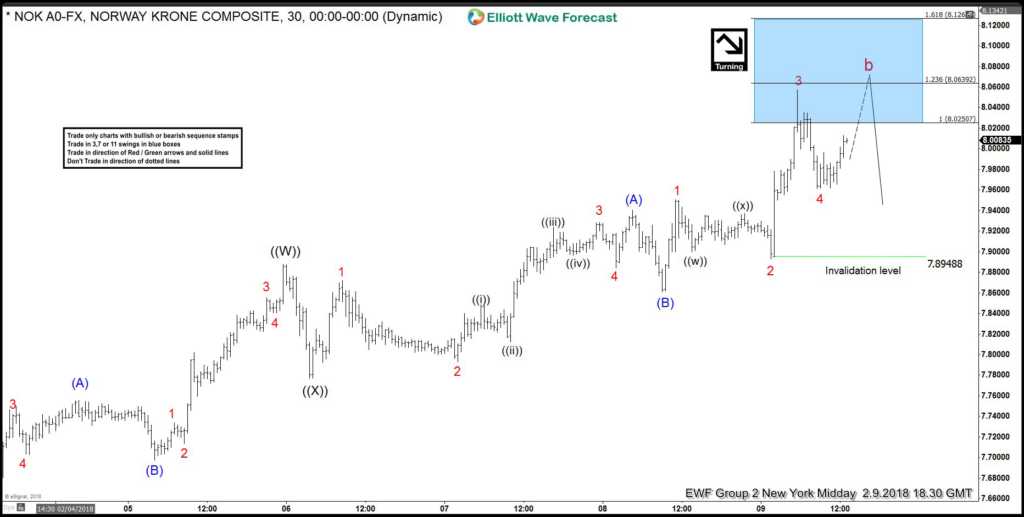
USDNOK 1 Hour Elliott Wave Analysis 2.9.2018
On the 02/09/18, the USDNOK trade was initiated at our high-frequency box which I mentioned earlier before. The market entered that area and pulled back very nicely to the downside. At that point, we indeed still mentioned a possibility that USDNOK can extend in red degree wave 5 to end red “b” correction. However, this has not changed our overall short strategy in this pair.
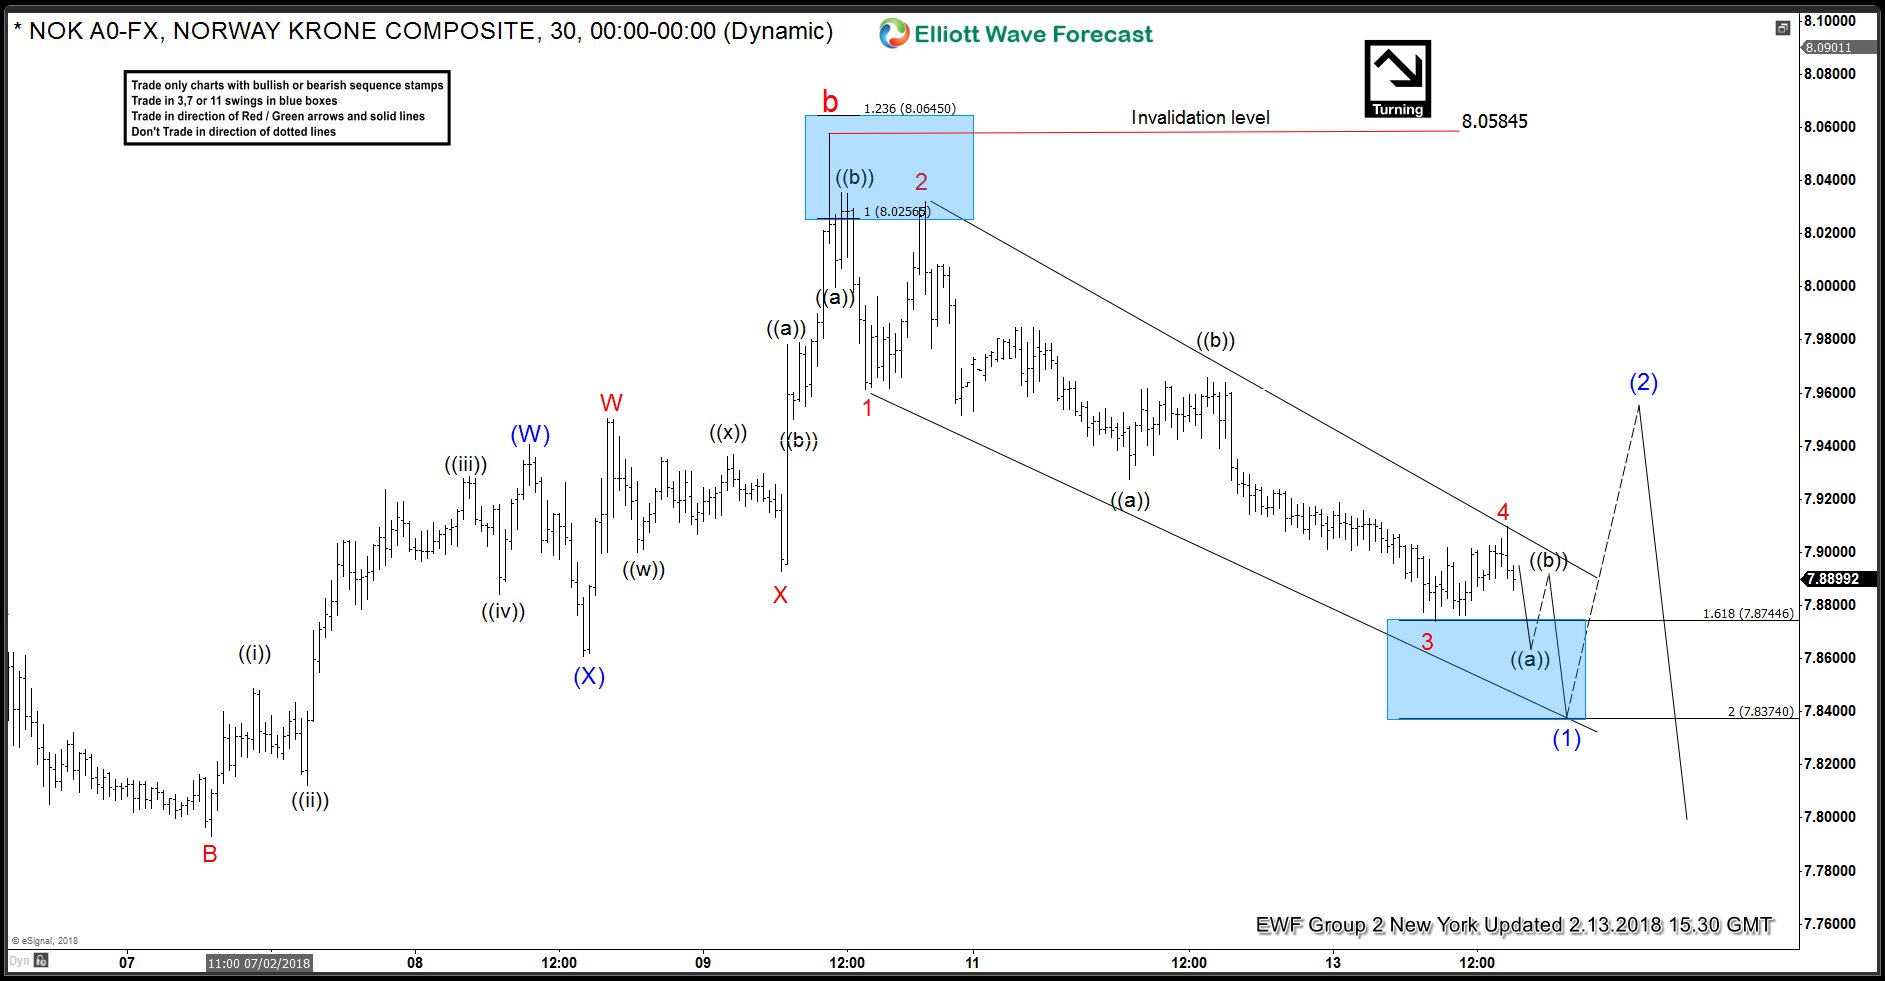
USDNOK 1 Hour Elliott Wave Analysis 2.13.2018
Now, in the chart below you can see our recent 1-hour London update from USDNOK. You can see that the market nicely pulled back from our area. And the short trades which we proposed to our members in our live trading room is now break even. Which means that the trade is risk-free. Ideally, the market now should continue its weakness to the downside.
It’s very important to stick to the rules and avoid jumping in trades early or chasing the trend later. We at Elliott Wave Forecast cover 78 instruments and therefore we have strict rules on how to trade. Therefore, it allows us to be profitable in the long run. There will always be new opportunities to make profits.
Keep in mind that markets are very dynamic and the short-term view could have ended in the meantime and have already changed. If you’re interested in new trading setups across forex pairs, indices, stocks, ETFs or bitcoin you can try our work 14 for FREE. Just click here.
We cover 78 instruments in total, but not every chart is a trading recommendation and our members know that. We present Official Trading setups in 3 Live Trading Rooms every day! If not you are not a member yet, Sign Up for Free 14 days Trial now and get access to new trading opportunities.
Through time we have developed a very respectable trading strategy which defines Entry, Stop Loss and Take Profit levels with high accuracy and allows you to make position Risk Free, shortly after taking it.
Back


