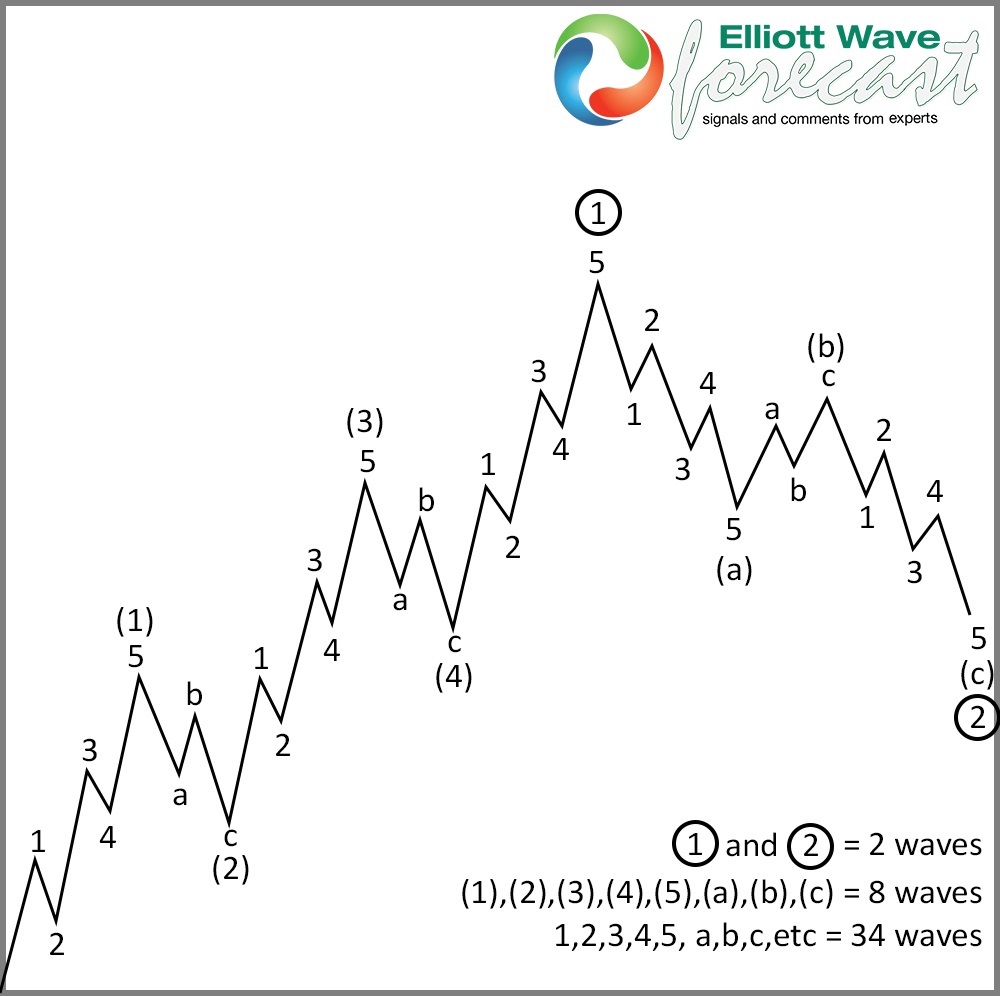
The Elliott Wave Theory, as many traders know, was developed in the 1930′ and the main pattern is the 5 waves structure followed by 3 waves pullback. The Theory was developed based on The Dow Jones Index. Nowadays the Theory is used by traders to forecast any type of instruments like Stocks, Indices, Commodities, and Forex. In the chart below you can see how a 5 waves advance structure with a 3 waves pullbacks, in theory, looks like. In the next paragraph, we will have a look at the USDMXN Elliott Wave view.
USDMXN Elliott Wave Analysis 03.09.2018
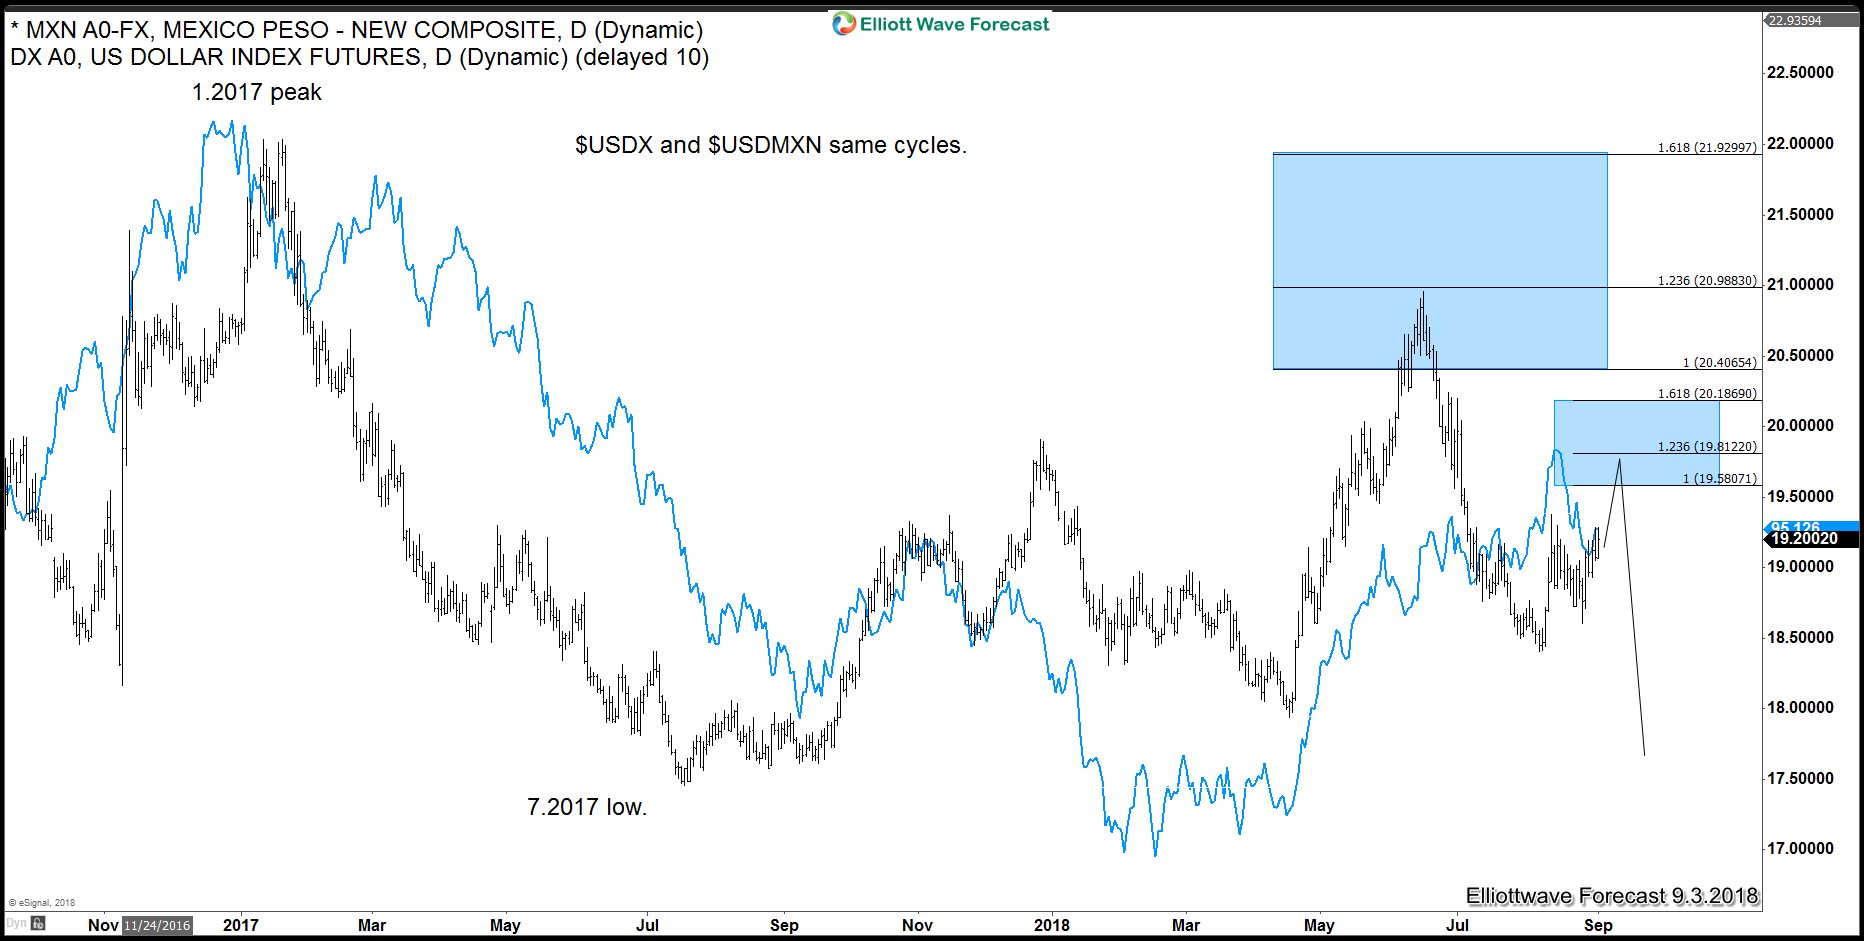
The USDMXN Elliott Wave Analysis shows a clear 5 waves structure. With the high correlation to the DXY, it can possibly give us a clue on how the Dollar Index can unfold in the future. We can see that the pair peaked at 1.2017. And from that peak, it has developed a 5 waves impulsive structure lower to the low at 7.2017. From that low, USDMXN bounced in a so-called 3 waves ABC correction and reached the equal legs area (blue box) of black ((A))-((B)) towards the area of 20.406-20.988. Where sellers have been waiting to push the USDMXN lower again in another 5 waves of lesser degree. Which you can see in the chart below.
USDMXN vs DXY Overlayed
The USDMXN chart is easy to compare with the classic Elliott Wave Pattern. You see, that the outcome should result in MXN strength and consequently a lower Dollar either to resume the decline or a 3 waves pull back at minimum to correct the cycle from 8/27 (18.59) low and then turn higher again into a triple three (11 swings) structure before turning lower again. That is something we are expecting to happen soon based on many others instruments and tools across the Market.
In conclusion, the overlay of the USDMXN and the Dollar Index. Is indicating the possible outcome for both instruments.
The Elliott Wave Theory is very subjective by nature and even more when used in Forex or Commodity markets. The Elliott wave Theory was developed based on the stock market. Therefore, a classic 5 waves pattern can be spotted more often in that asset class. However, looking at this USDMXN Daily chart. You can clearly see that the USDMXN shows a classic 5 waves Elliott Wave pattern.
The equal legs area (second blue box above) of the lesser degree comes between 19.58-20.18. Which can be a good area to sell the pair and also to build short position against the Dollar. That area would either resume the decline for new lows below or only have the pair pulling back to correct the cycle from 8/27 (18.59) low and then turn up again to complete proposed wave ((2)) as a WXYZY structure. In either case, area between 19.58 – 20.18 should produce a 3 waves pull back as per Elliott wave hedging. At Elliottwave-forecast.com. We follow more than 78 instruments and we understand that the Financial Markets act as a whole. That is why we follow our so-called “One Market Only Concept“.
We use Elliott wave Theory with the most advanced idea and combine it with cycles, sequences, correction with subdivisions of instrument, distribution and more.
Back


