Last Friday Australian Dollar dipped to a two-and-a-half-year low after it broke blow 71 US cents due to a rising US Dollar and escalation in US-China trade wars. The last time the Australian Dollar traded below 71 US cents was on February 2016. The currency fell out of favor after last week’s comment by President Trump.
Mr. Trump said that the additional $200 billion tariff to Chinese goods can take place very soon. This additional tariff measure has been announced in July and the public comment period has ended last Friday. Beijing has indicated that they will quickly retaliate in $60 billion worth of U.S. goods if the U.S. goes ahead with the tariff. So far, the U.S. has imposed tariffs on $50 billion on Chinese goods and China has retaliated in kind.
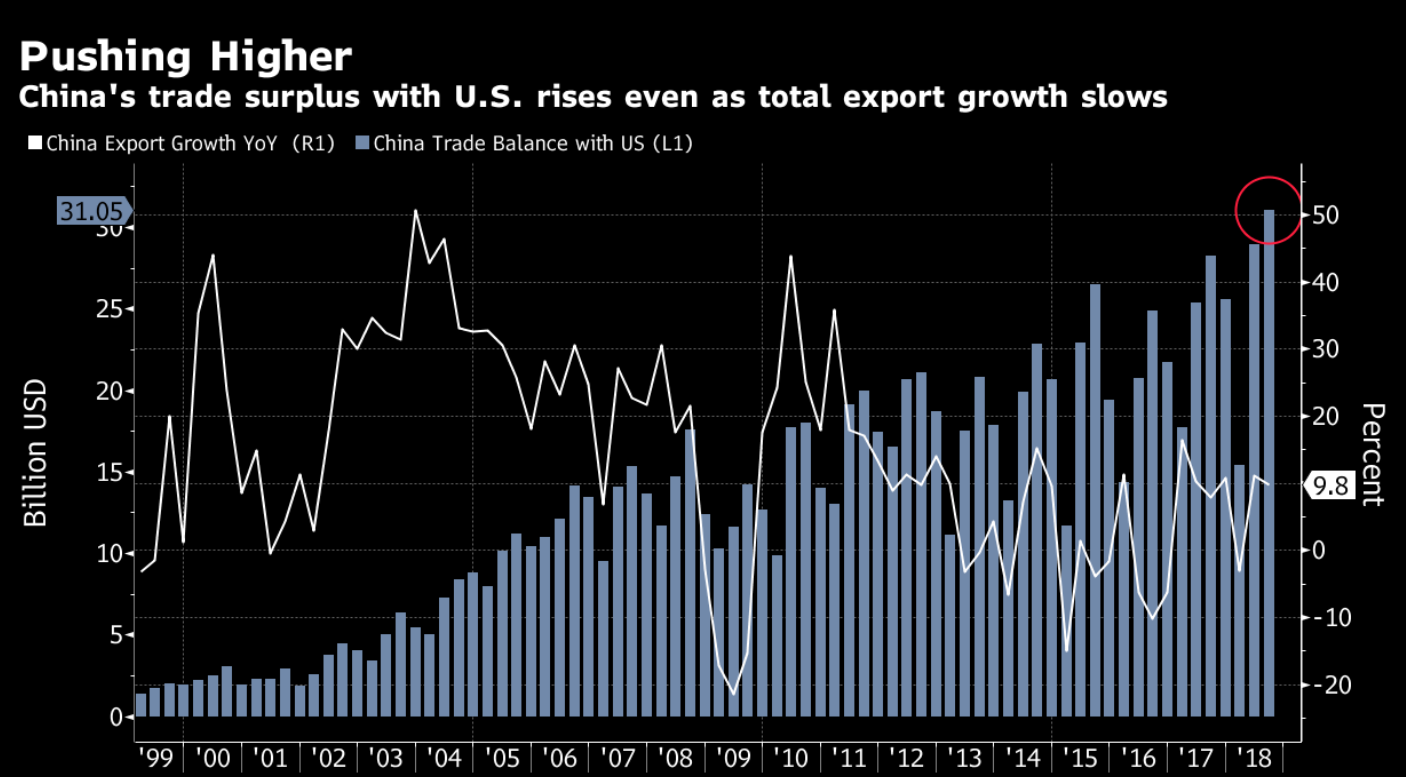
On top of that, Mr. Trump doubled down his threat on Friday saying he’s ready to slap tariffs on additional $267 billion at short notice. This will effectively tax all the $505 billion Chinese imports. The latest numbers from China however suggests the surplus trade with the U.S rose at a record $31.1 billion in August. This could be due to front loaded orders by U.S. importers before the additional tariffs on $200 billion take effect.
The Australian Dollar has suffered from this continued threat of escalating trade wars as China is Australia’s main export customer and one of its major trading partners. Any negative impacts to China then could likely hurt Australia as well. The market can continue to price in the additional tariff and further escalation of trade war until there’s any evidence of successful talk.
Long Term Technical Analysis of $EURAUD

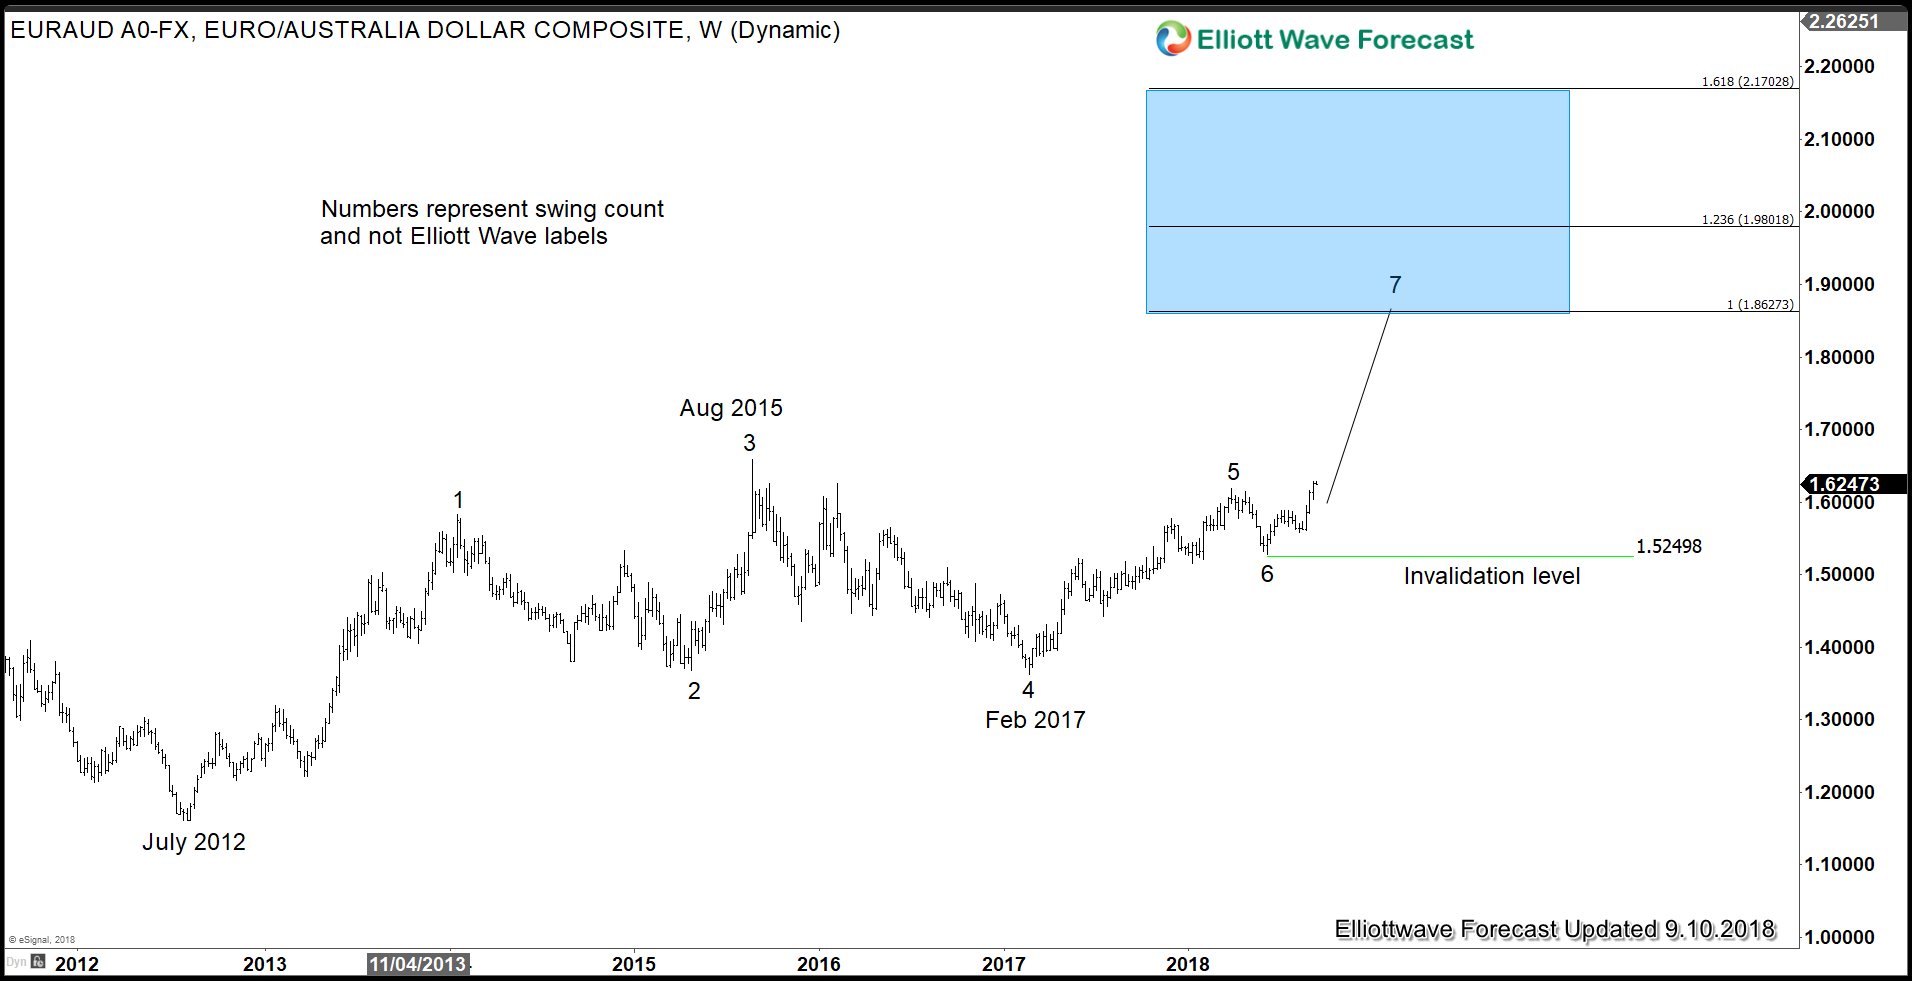
One of the Australian Dollar crosses EURAUD appears bullish and this view will get confirmation if it manages to break above swing #3 on August 2015 at 1.6585. The pair is currently showing a bullish (higher high) sequence from Feb 2017 low and as far as the dips stay above swing #6 at 1.525, it could continue to push higher, suggesting that Australian Dollar can continue to see weaknesses.
Please note the numbers on the chart represent swing count and not an Elliott Wave label. The proposed 7 swing structure from July 2012 low at above chart denotes a double three or WXY Elliott Wave structure. For further analysis in the pair, other Forex pairs, stocks, or commodities, you can try our 14 days FREE Trial We cover 78 instrument (Forex, Stocks, Commodities) using Elliott Wave forecasting technique in 4 time frames.
Back


