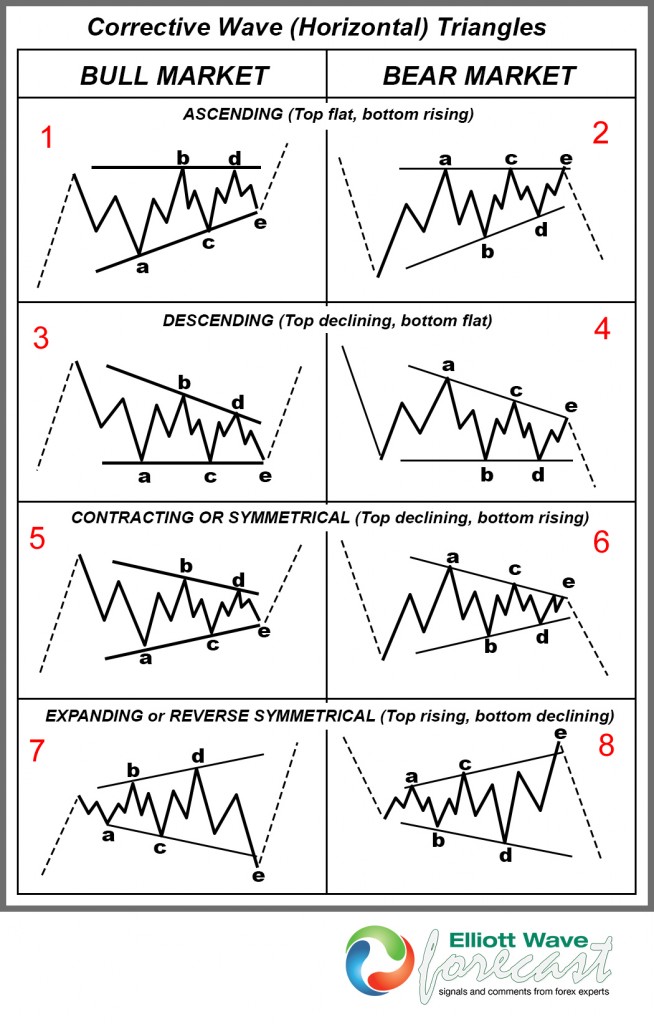
Triangles pattern occur quite frequently in the market, and it’s one of the best patterns to trade. In this blog, we are going to take a look at how to trade the triangle pattern. There are 8 different types of triangles, as can be seen in the chart below:
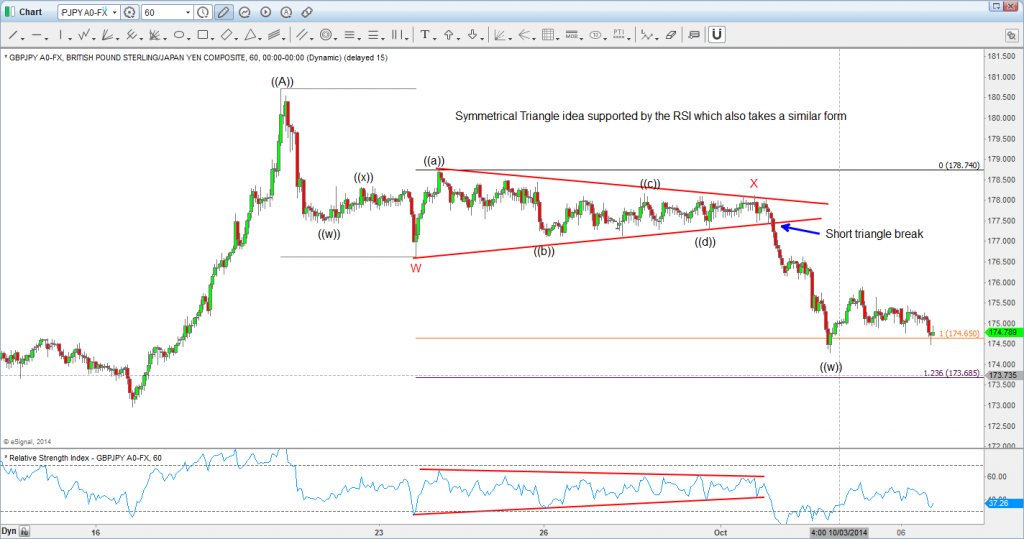
In this blog, we will take a look at an example of a bearish contracting / symmetrical triangle (number 6 above). Let’s take a look at GBP/JPY 1 hour chart below:
From the chart above, we can see a contracting triangle from wave W to wave X with subdivision of ((a)), ((b)), ((c)), ((d)), and ((e)). Furthermore, it’s also supported by the RSI that also takes the shape of contracting triangle.
One way to trade this triangle pattern then is to sell it when price breaks out and closes below this triangle pattern. The condition is that we can already count 5 subdivision wave a to wave e in the triangle and secondly, it’s also supported by the break in the RSI’s triangle pattern. Stop Loss can be placed above wave X in this case, with the nearest equal leg target ((A)) – W, measured from ((a)) at 174.65.
So in GBP/JPY case, short trade is entered when 1 hour candle closes breaks out and closes below the triangle at 177.23. Stop Loss is placed above wave X at 178.12, and nearest equal leg target of 174.65 for a risk:reward of almost 3:1.
Thank you for reading and if you would like to know the next path in GBP/JPY and 25 other instrument, I invite you to join us with our 14 day Trial. We have 24 hour coverage of 26 instruments from Monday – Friday. We provide Elliott Wave chart in 4 different time frames, four times update of 1 hour chart throughout the day, two live sessions by our expert analysts, 24 hour chat room moderated by our expert analysts, market overview, and much more! With our expert team at your side to provide you with all the timely and accurate analysis, you will never be left in the dark and you can concentrate more on the actual trading and making profits.
Kind regards,
Hendra Lau – Technical Analyst at Elliott Wave Forecast
Back


