Hello fellow traders. The YEN group has been selling lately across the board and the path has become more clear with the SEKJPY breaking its 2016 lows.
We at Elliott Wave Forecast trade the Market different than most other market participants. We track over 100 instruments across the world. That allows us to locate the right side. We use the Elliott Wave Theory together with cycles, sequences and correlation and lot more.
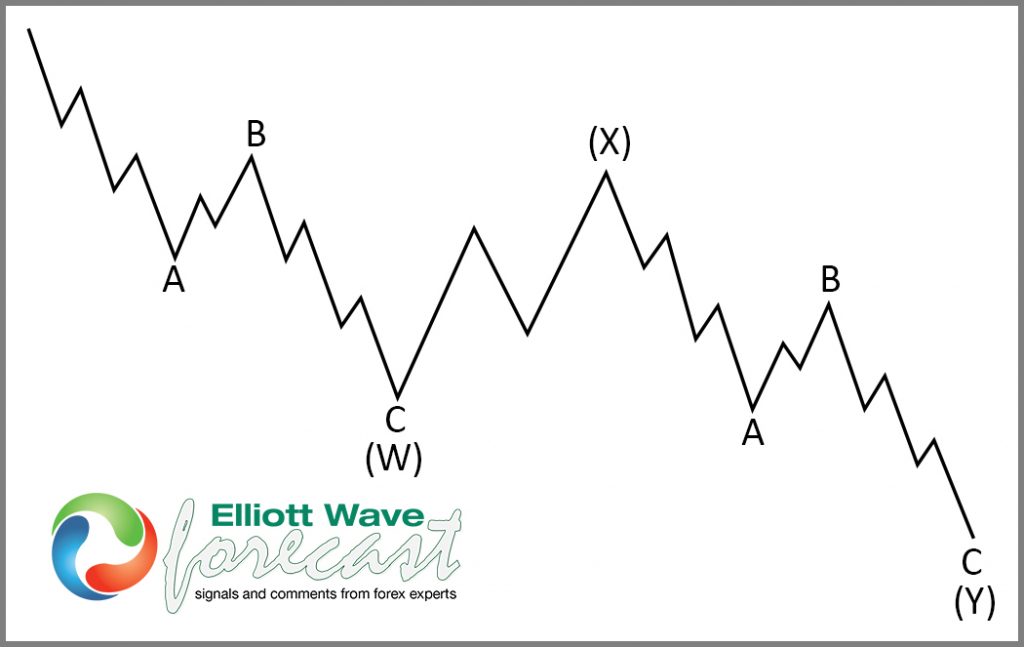
Market move in sequences of 3-7-11 and for us, that is very important. Currently, a 7 swings structure is taking place in the SEKJPY from its 2014 peak. This is how a sequence looks in the Elliott Wave Theory.

In the chart above we can see 3 swings lower ABC into (W) and then a connector and then another 3 waves lower which completed the 7 swings sequences. Let’s have a look now at the SEKJPY.
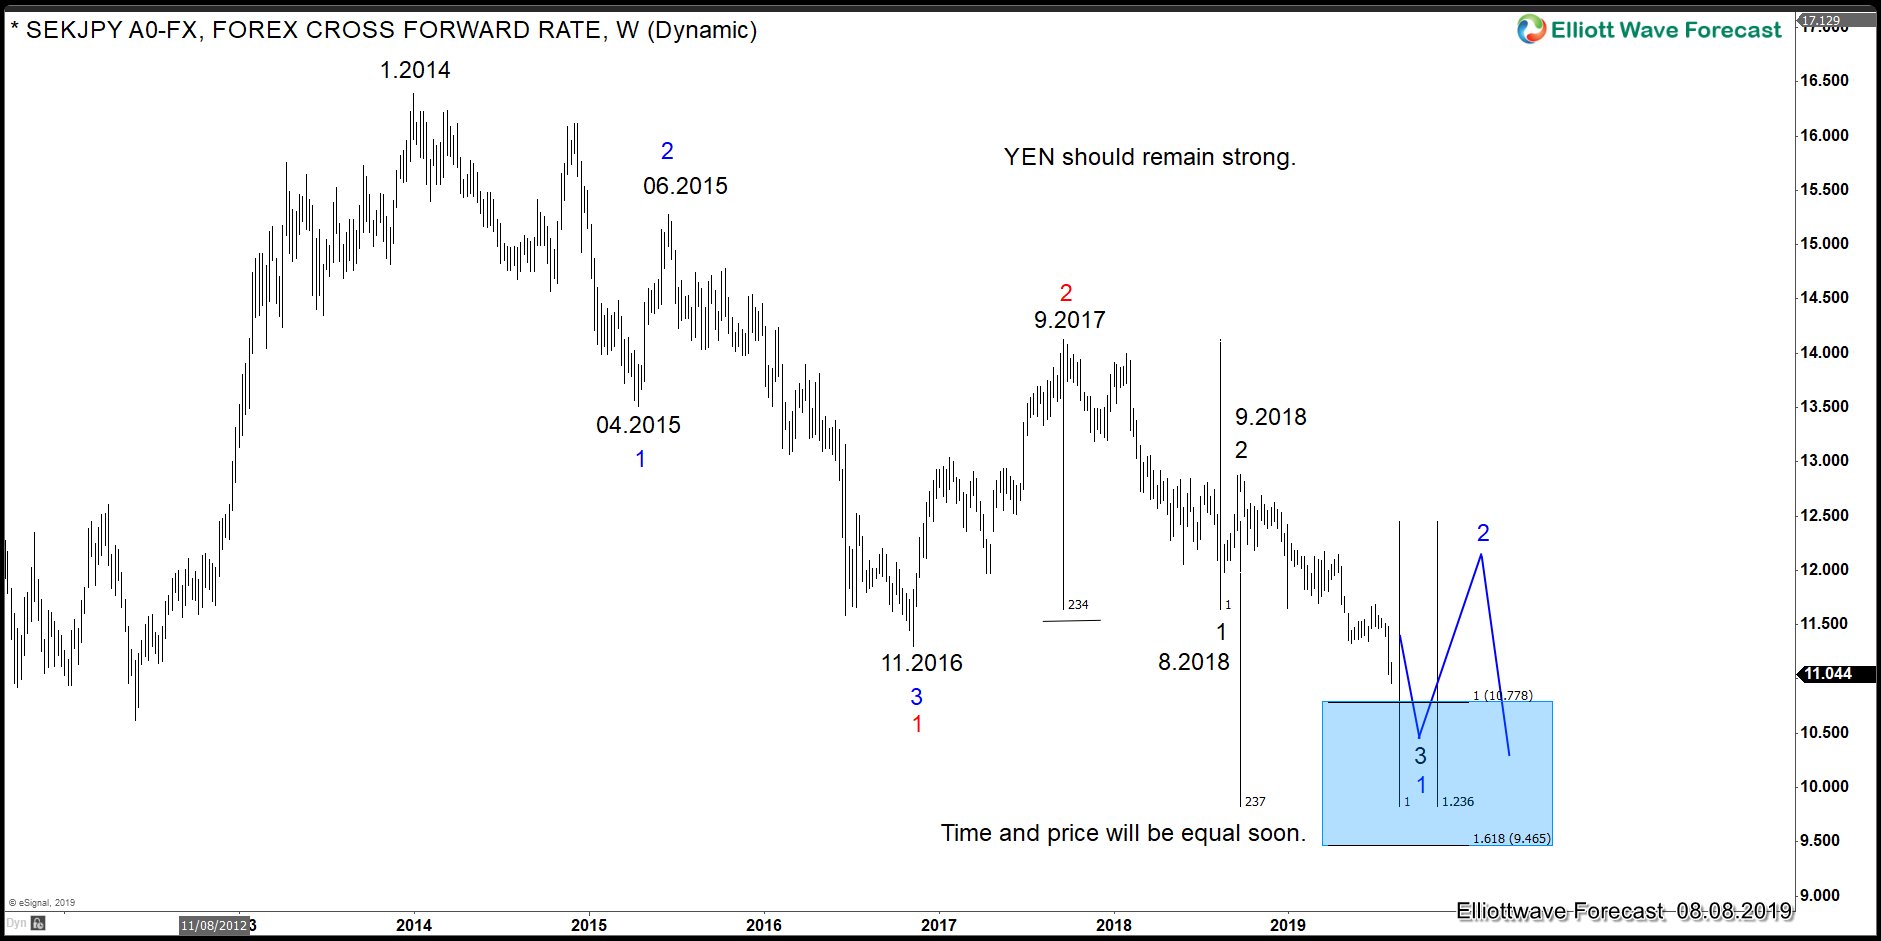
The SEKJPY is part of the YEN group. The following chart shows the sequence in the weekly chart of the Instrument.
SEKJPY Weekly Elliott Wave Analysis 8.8.2019
We can see how from its 2014 peak the instrument did 3 waves lower into its 2016 low in red 1. Above from there, it bounced higher into its 2017 peak. Below from it managed to break to new lows making it a lower low sequence which should be ending the cycle from 2017 peak and it should reach extreme in time and price soon towards 10.77-9.46 area in price and in time will be the same amount of swings 1. We can see 3 degrees at the chart, Red, Blue, and Black from higher to lower degree and the combination of them makes the forecast act as a whole. The following video explains the idea and why the YEN should be strong.
Back


