Back in October 2019, we mentioned that SEKJPY had reached extreme area down from September 2017 peak and should bounce soon in 3 or 7 swings which should fail for more downside. In this article, we will look at the price action which followed since then and what is expected next in the pair. First of all, let’s take a look at the chart from October 2019.
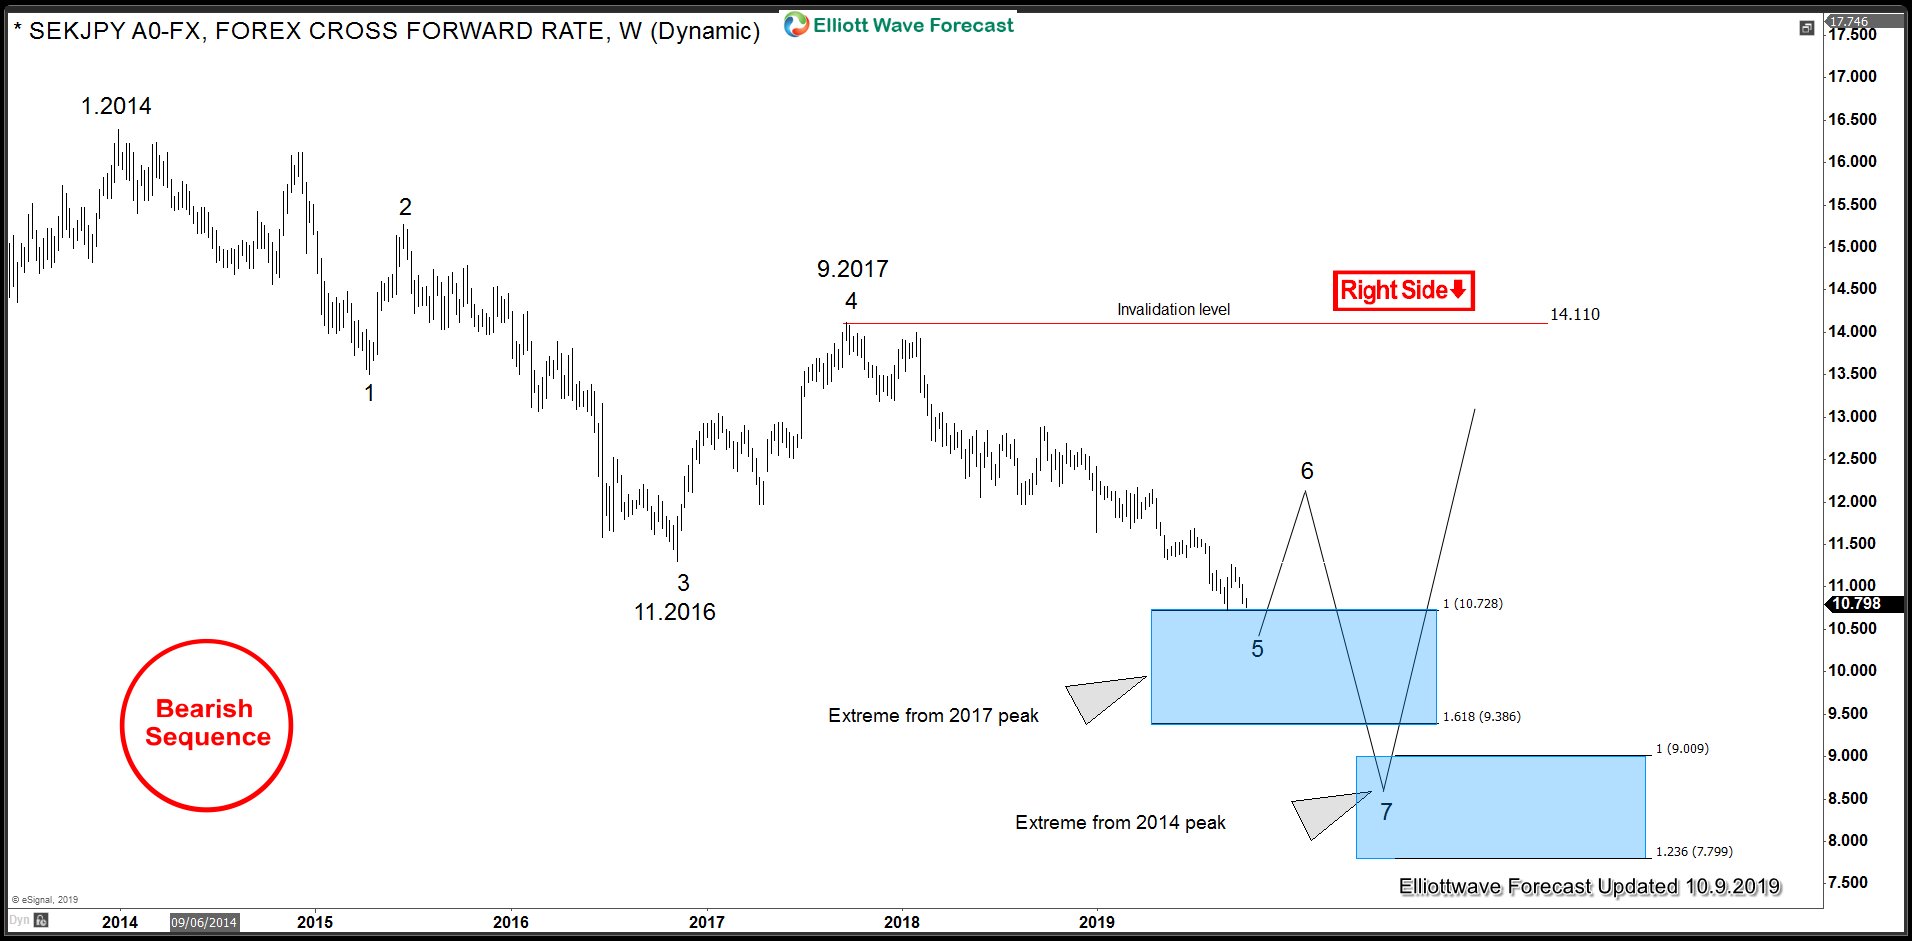
SEKJPY Swing Sequence Chart 10.9.2019
As the chart below shows, back in October 2019, pair showed 5 swings down from January 2014 peak and at the same time, it had reached 100% Fibonacci extension of the 1st leg down from September 2017 peak and therefore, we expected cycle from September 2017 peak to end in the blue box between 10.728 – 9.386 and pair to bounce in 3 or 7 swings before resuming the decline toward 9.009 – 7.799 area.
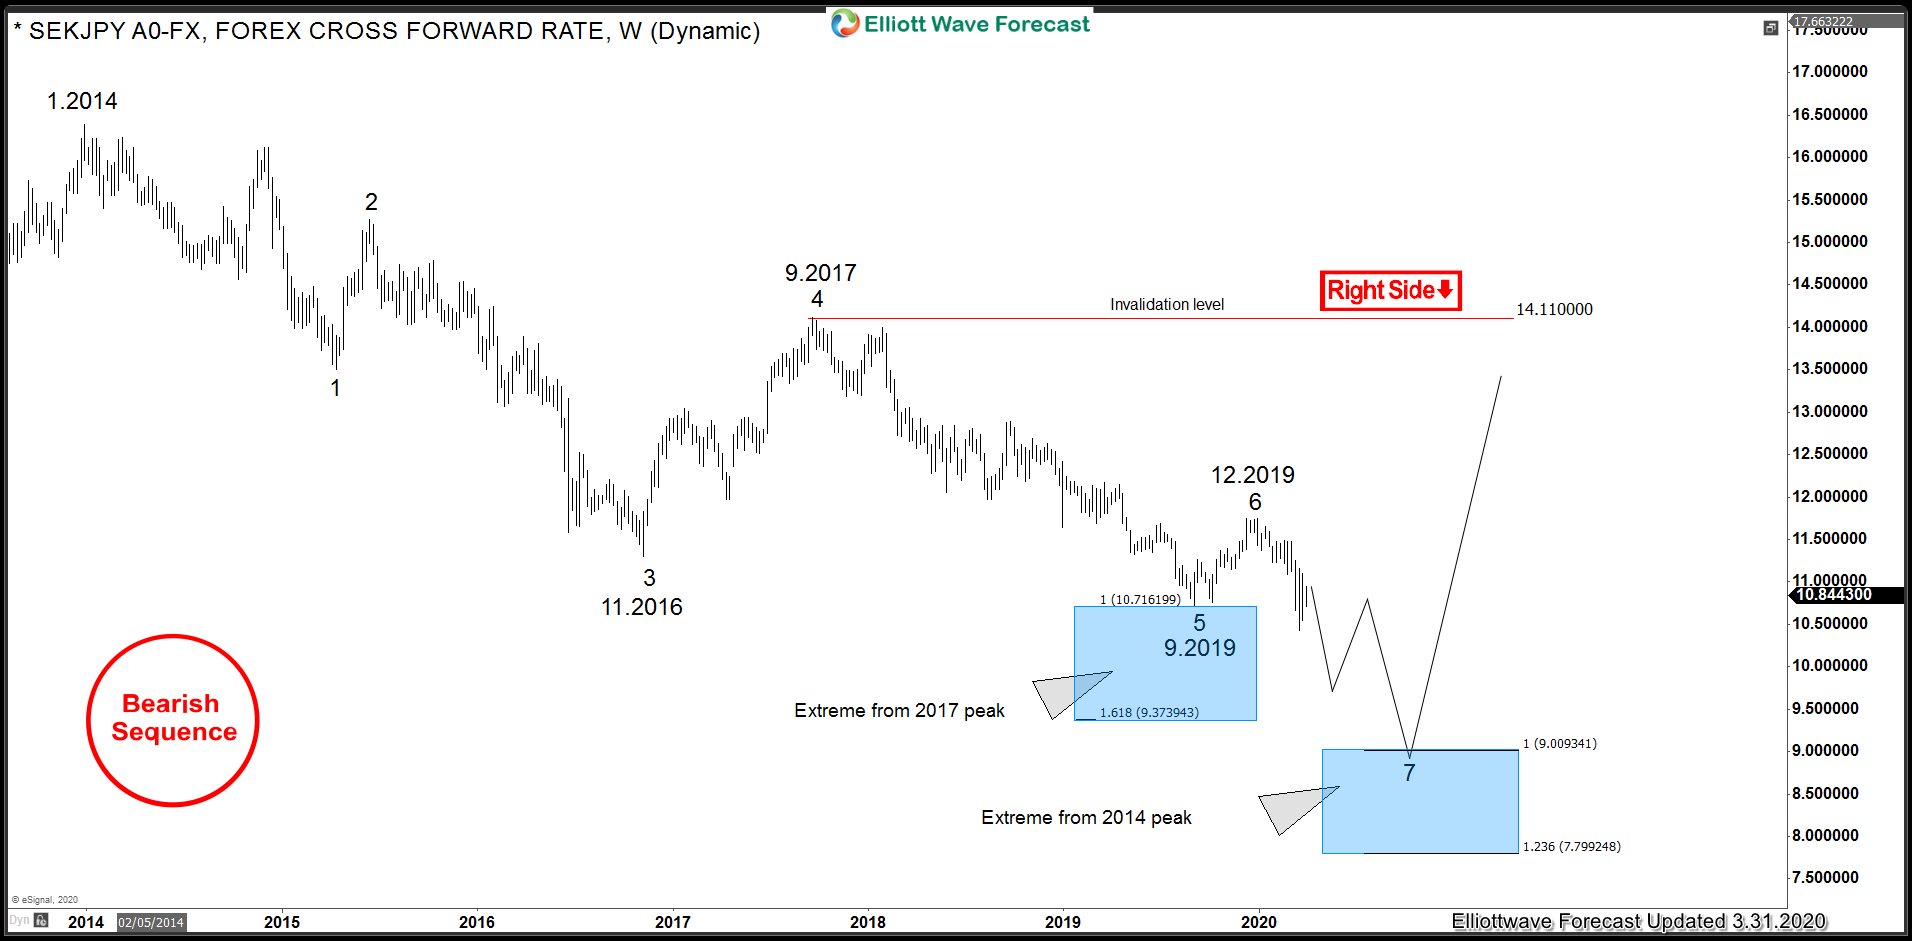
SEKJPY Swing Sequence Chart 3.31.2020
In the chart below we can see pair did bounce from the blue box area between 10.728 – 9.386 and has already made a new low below September 2019 low and previously it had an incomplete sequence down from January 2014 peak and now it has another incomplete bearish sequence down from September 2017 peak and should see more downside as far as bounces stay below December 2019 peak.
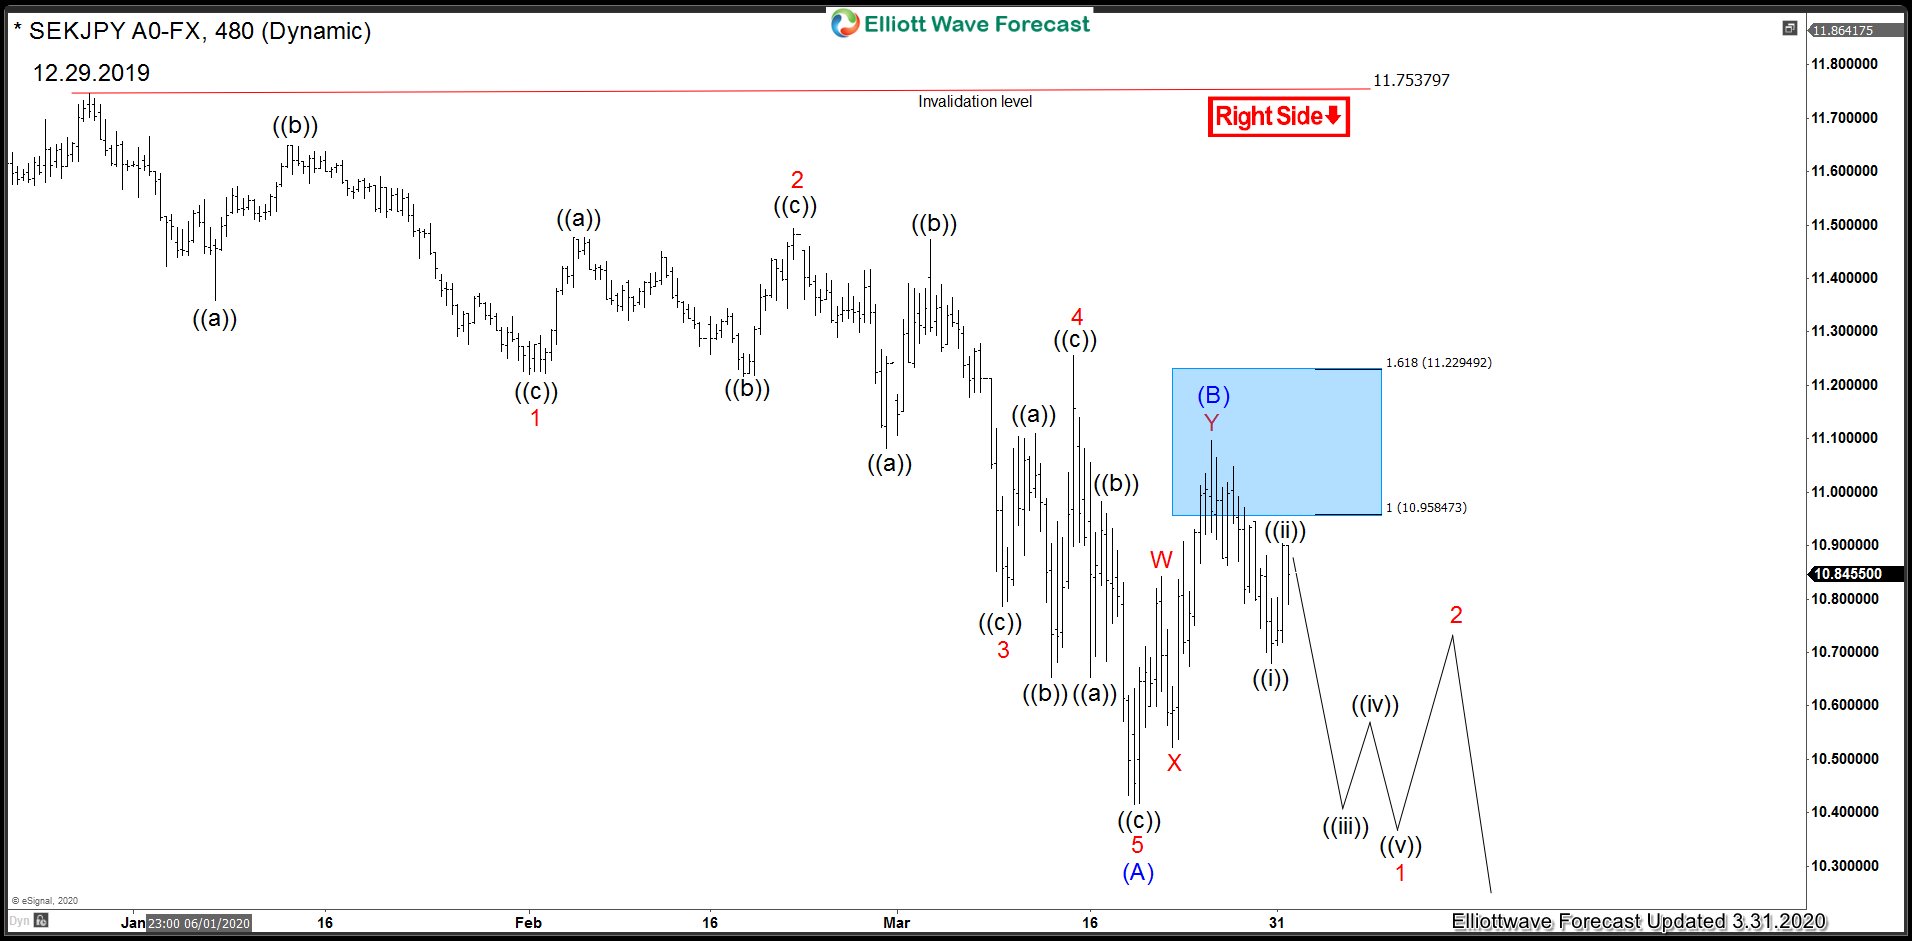
SEKJPY Elliott Wave Analysis – 8 Hour Chart – 3.31.2020
In the chart below, we look at the structure of the decline down from 12.29.2019 peak and what is expected next. Decline from 11.75 (12.29.2019) peak to 10.41 (3.18.2020) low could be counted as an 11 swings Elliott wave diagonal structure. We have labelled this as wave (A) and the corrective bounce to 11.09 is labelled as wave (B) completed. As bounces fail below 11.09 peak, we expect the pair to resume the decline for a new low below 10.41 ideally reaching 9.76 area. If pair fails to break below 10.41 low and breaks above 11.09 high, then we should still be in wave (B) and it could test 11.36 – 11.52 before resuming the decline. We don’t like buying the pair and favor more downside as far as 11.09 high and more importantly 11.75 high remains intact.
Back


