
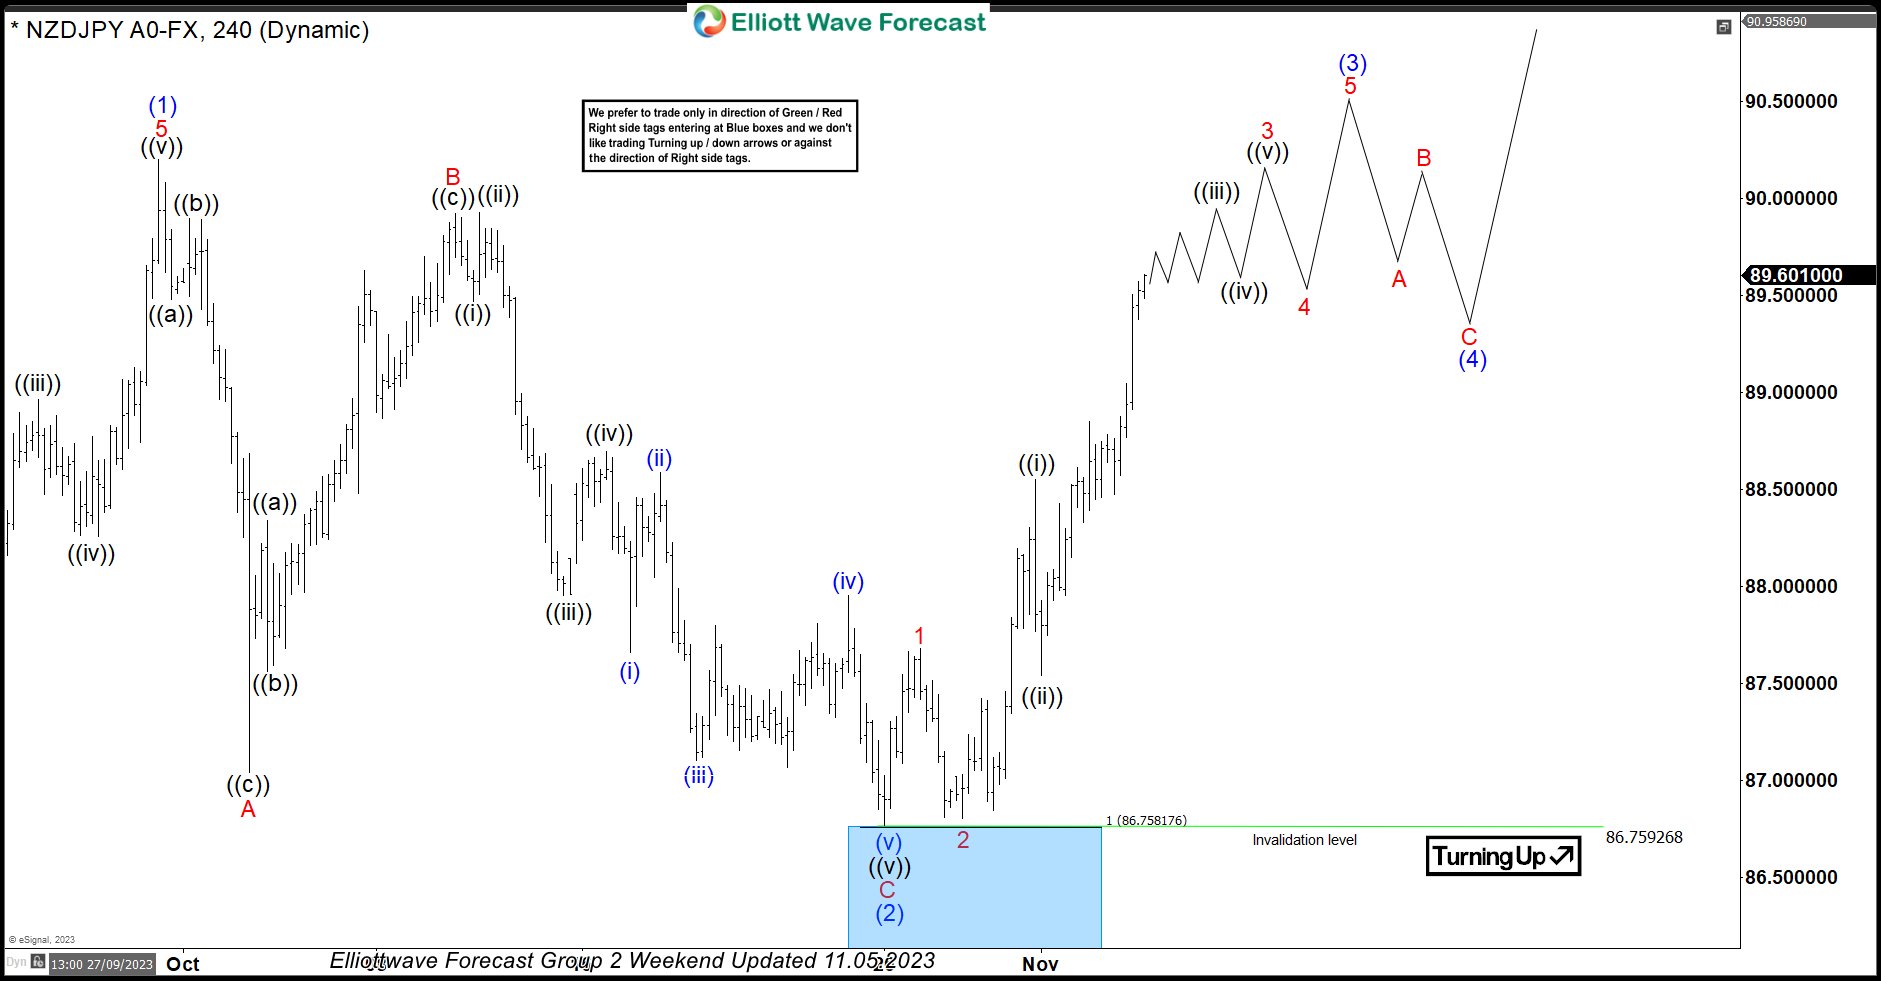
In this technical blog, we will look at the past performance of the 4-hour Elliott Wave Charts of NZDJPY. In which, the rally from 24 March 2023 low unfolded as an impulse sequence and showed a higher high sequence. Therefore, we knew that the structure in NZDJPY is incomplete to the upside & should extend higher. So, […]
-
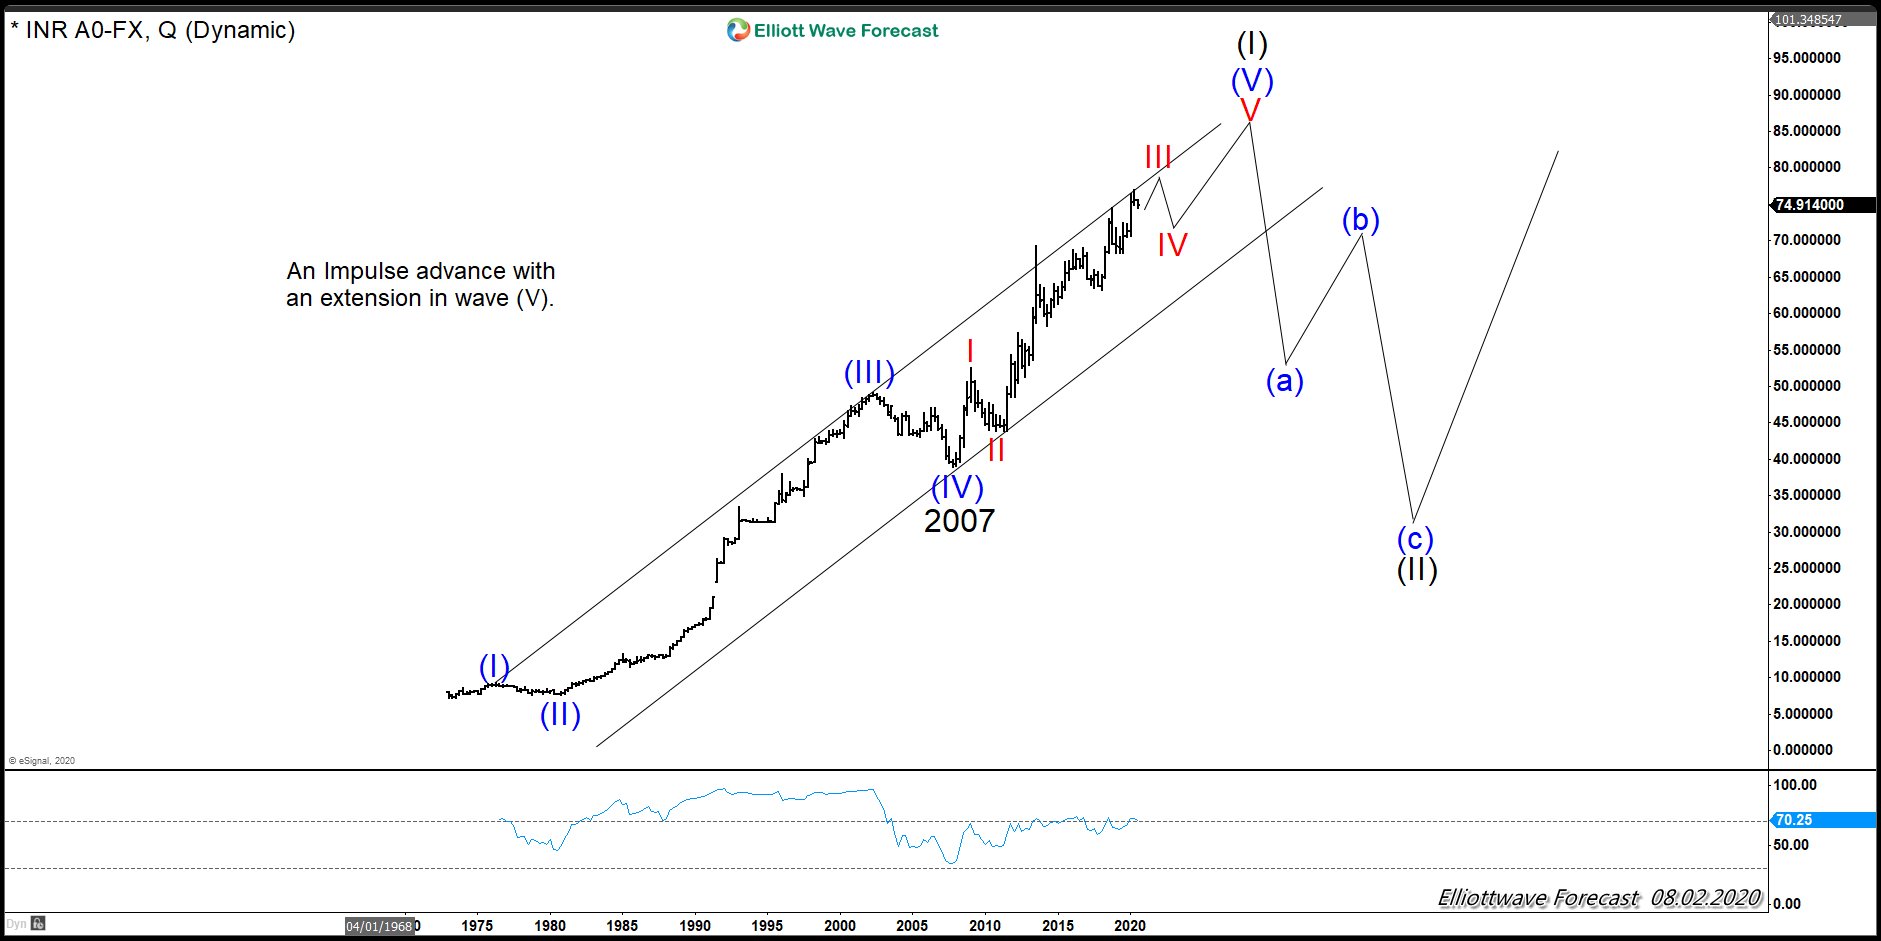
USDINR: The Pair Is Sending A Warning to $USDX
Read MoreThe USDX has been trending higher since the lows in 2008. However, in trading, nothing lasts forever. New traders generally do not last very long in this field, thus most traders only know a strong $USDX due to recency bias. However, in reality, nothing lasts forever, so we at EWF track many different instrument to be able […]
-
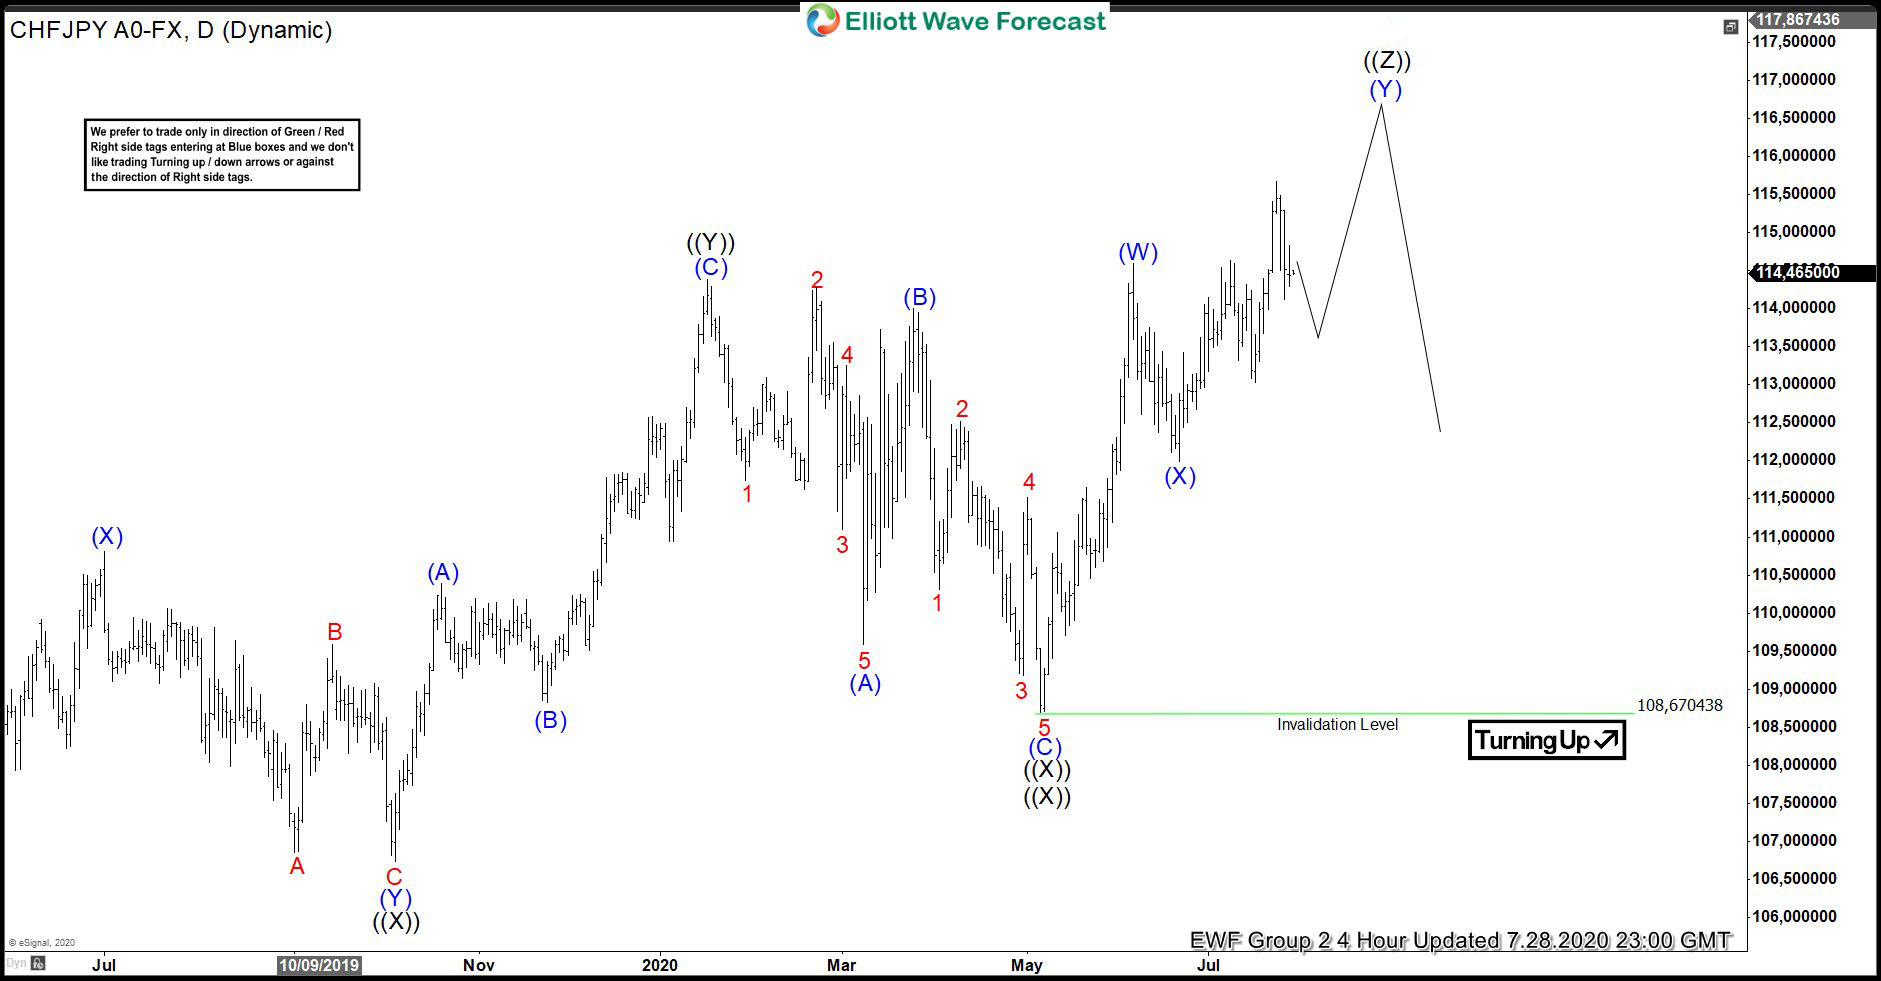
CHFJPY Incomplete Sequence Targeting Higher
Read MoreIn this blog, we are going to take a look at the Elliott Wave chart of CHFJPY. The Daily chart update below shows that the pair has continued to extend higher from October 4, 2019 low. Up from that low, the pair ended wave (A) at 110.39 high. The pullback in wave (B) ended at […]
-
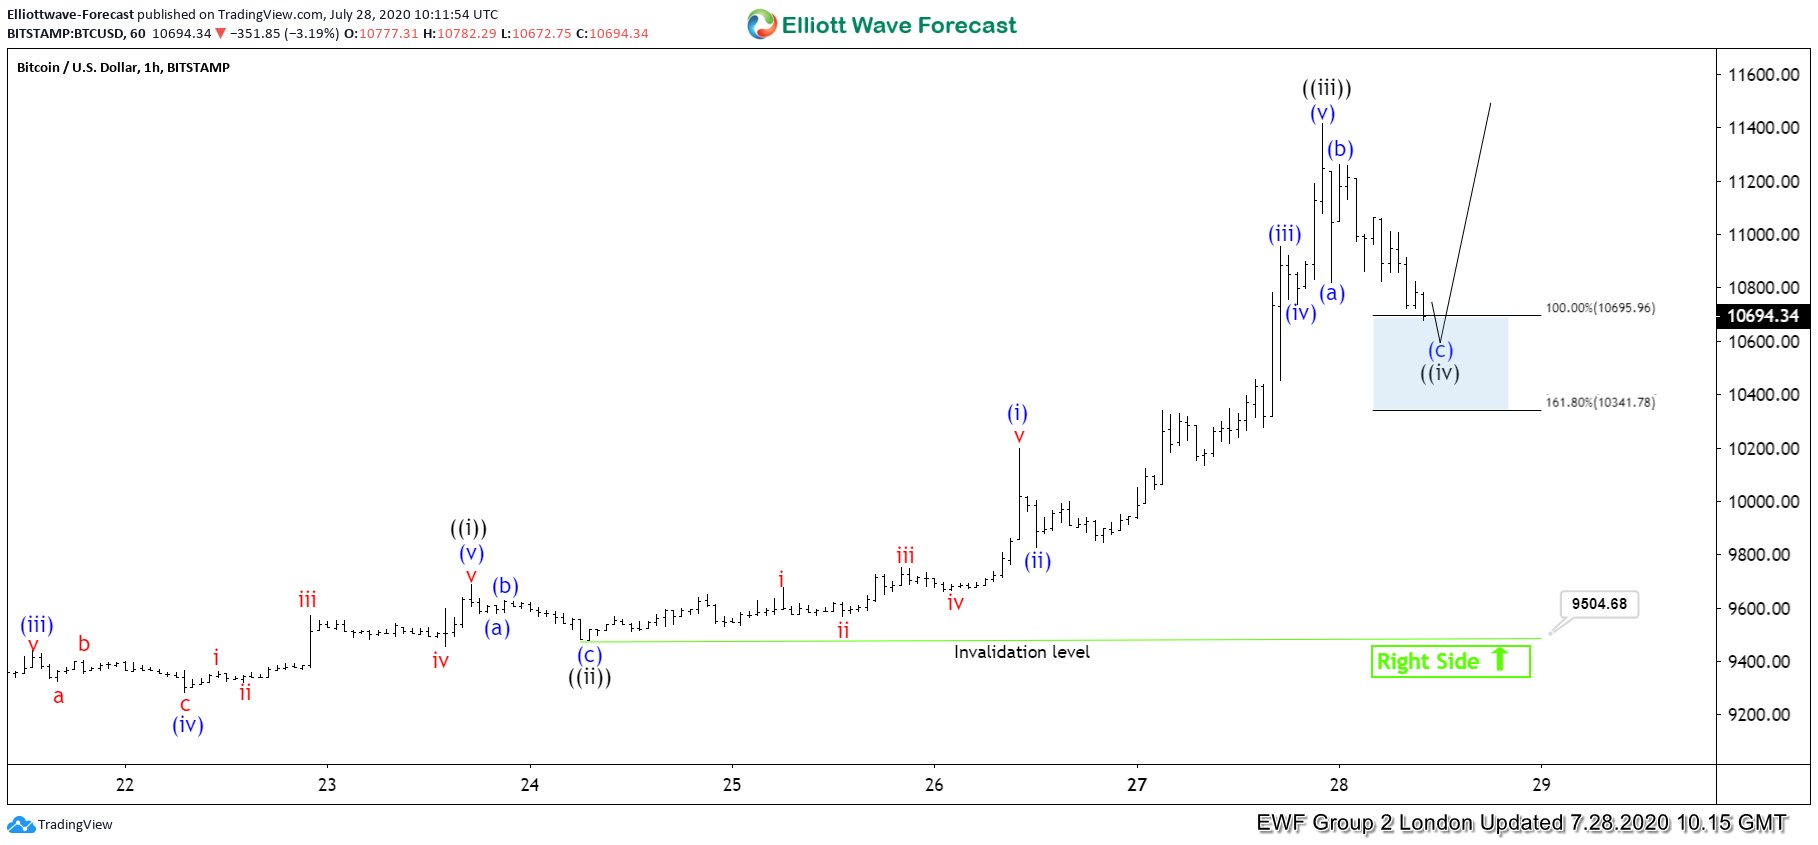
Bitcoin Entered Wave Four And Offered Buying Opportunity
Read MoreIn this blog, we take a look at the past performance of 1 hour Elliott Wave charts of Bitcoin In which our members took advantage of the blue box areas.
-
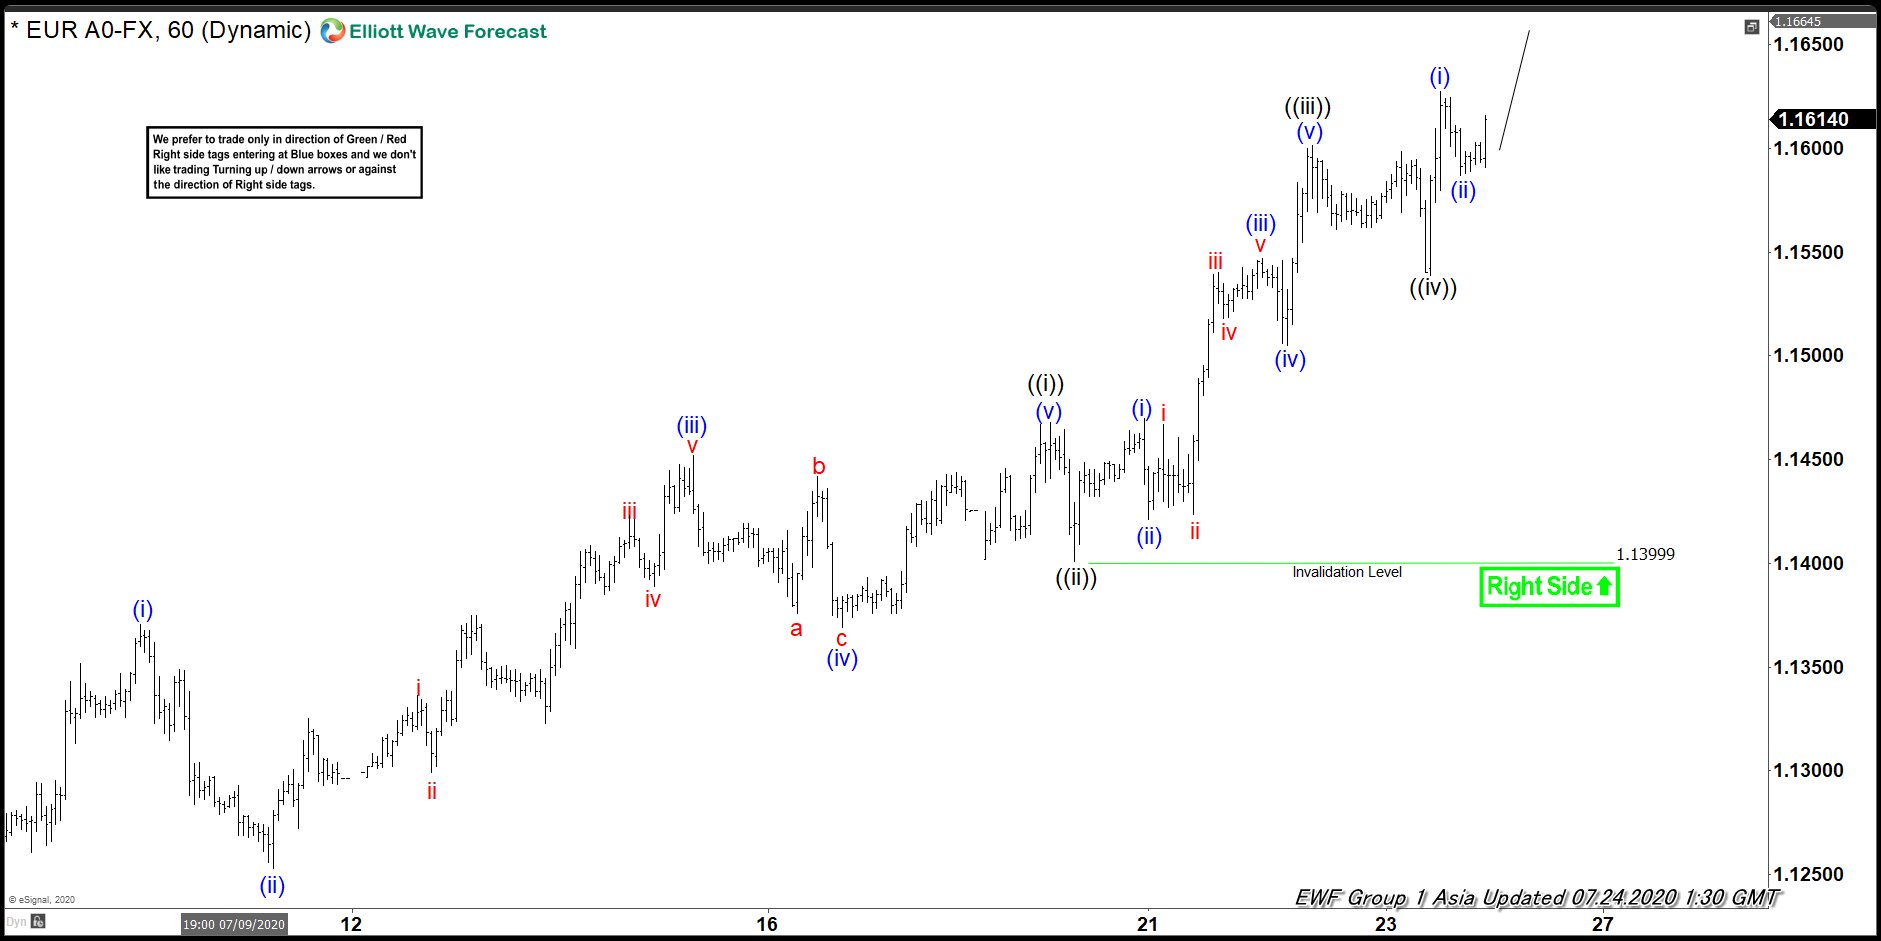
Elliott Wave View: Impulsive Rally in EURUSD
Read MoreEURUSD extended higher from July 1 low. While above July 20 low, expect dips in 3,7 or 11 swings to find support for further upside.
-
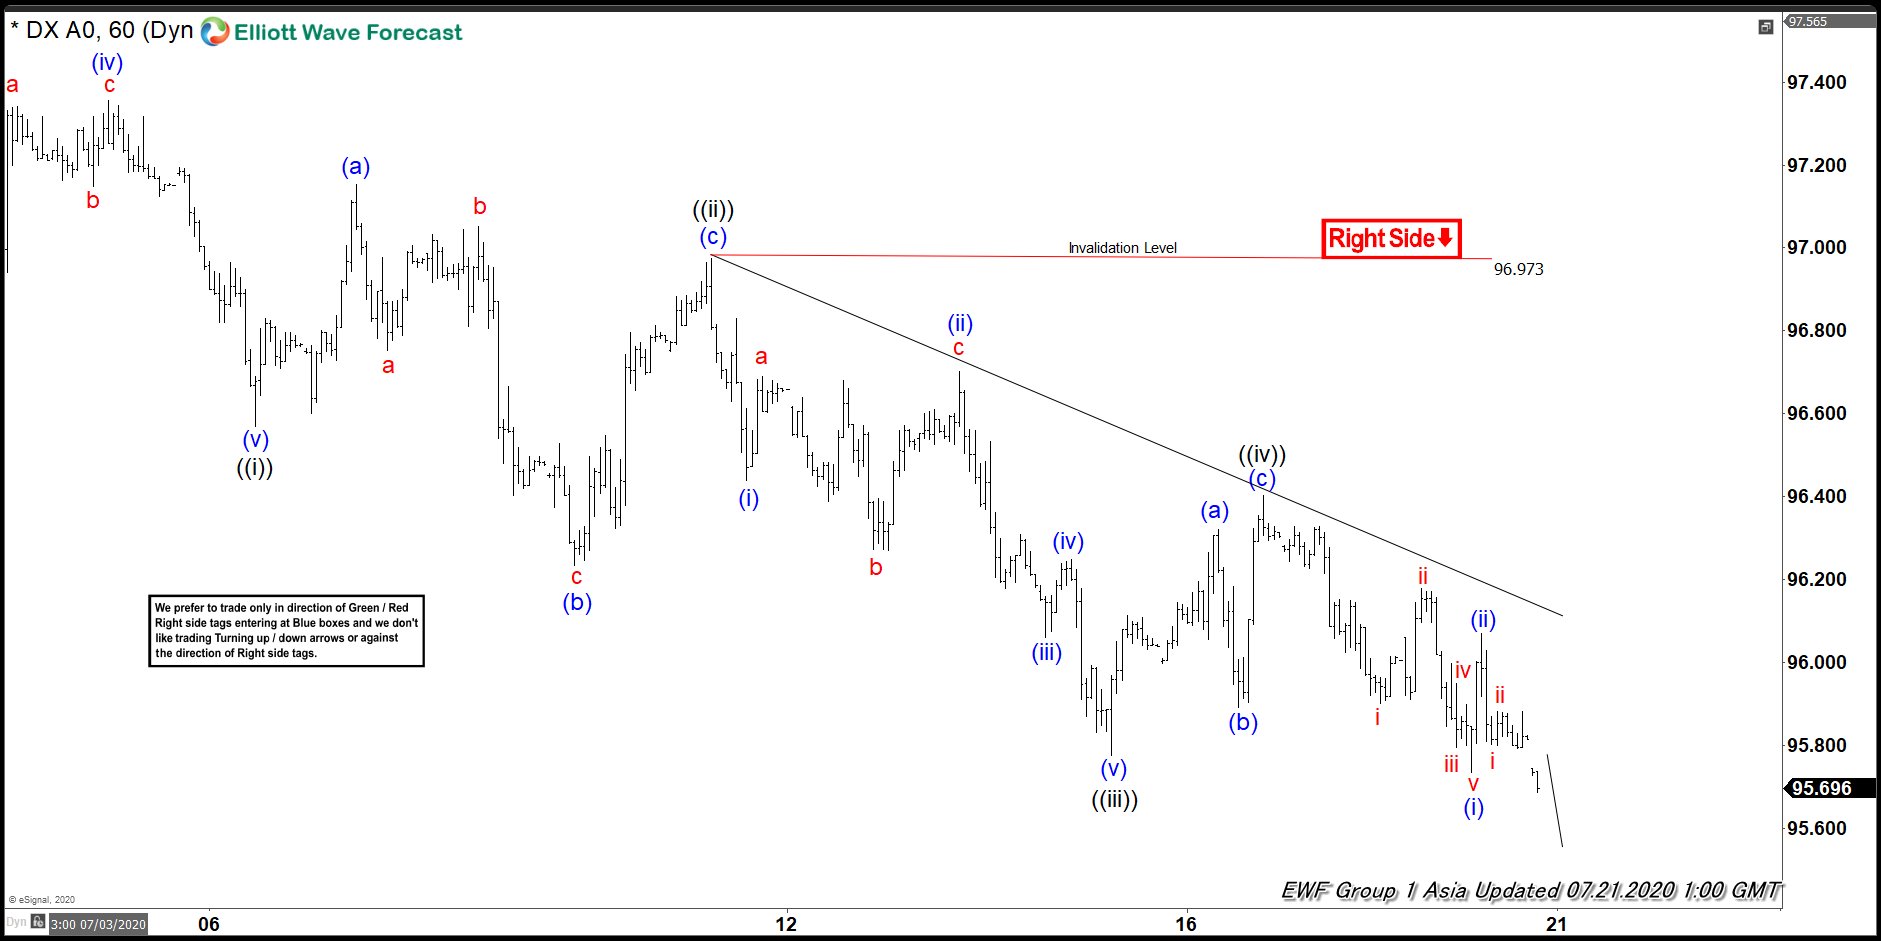
Elliott Wave View: Dollar Index (DXY) Ending Wave ((v))
Read MoreDXY has continued lower from June 30 high. While below July 10 high, expect the bounce in 3,7, or 11 swings to fail for more downside in the near term.
-
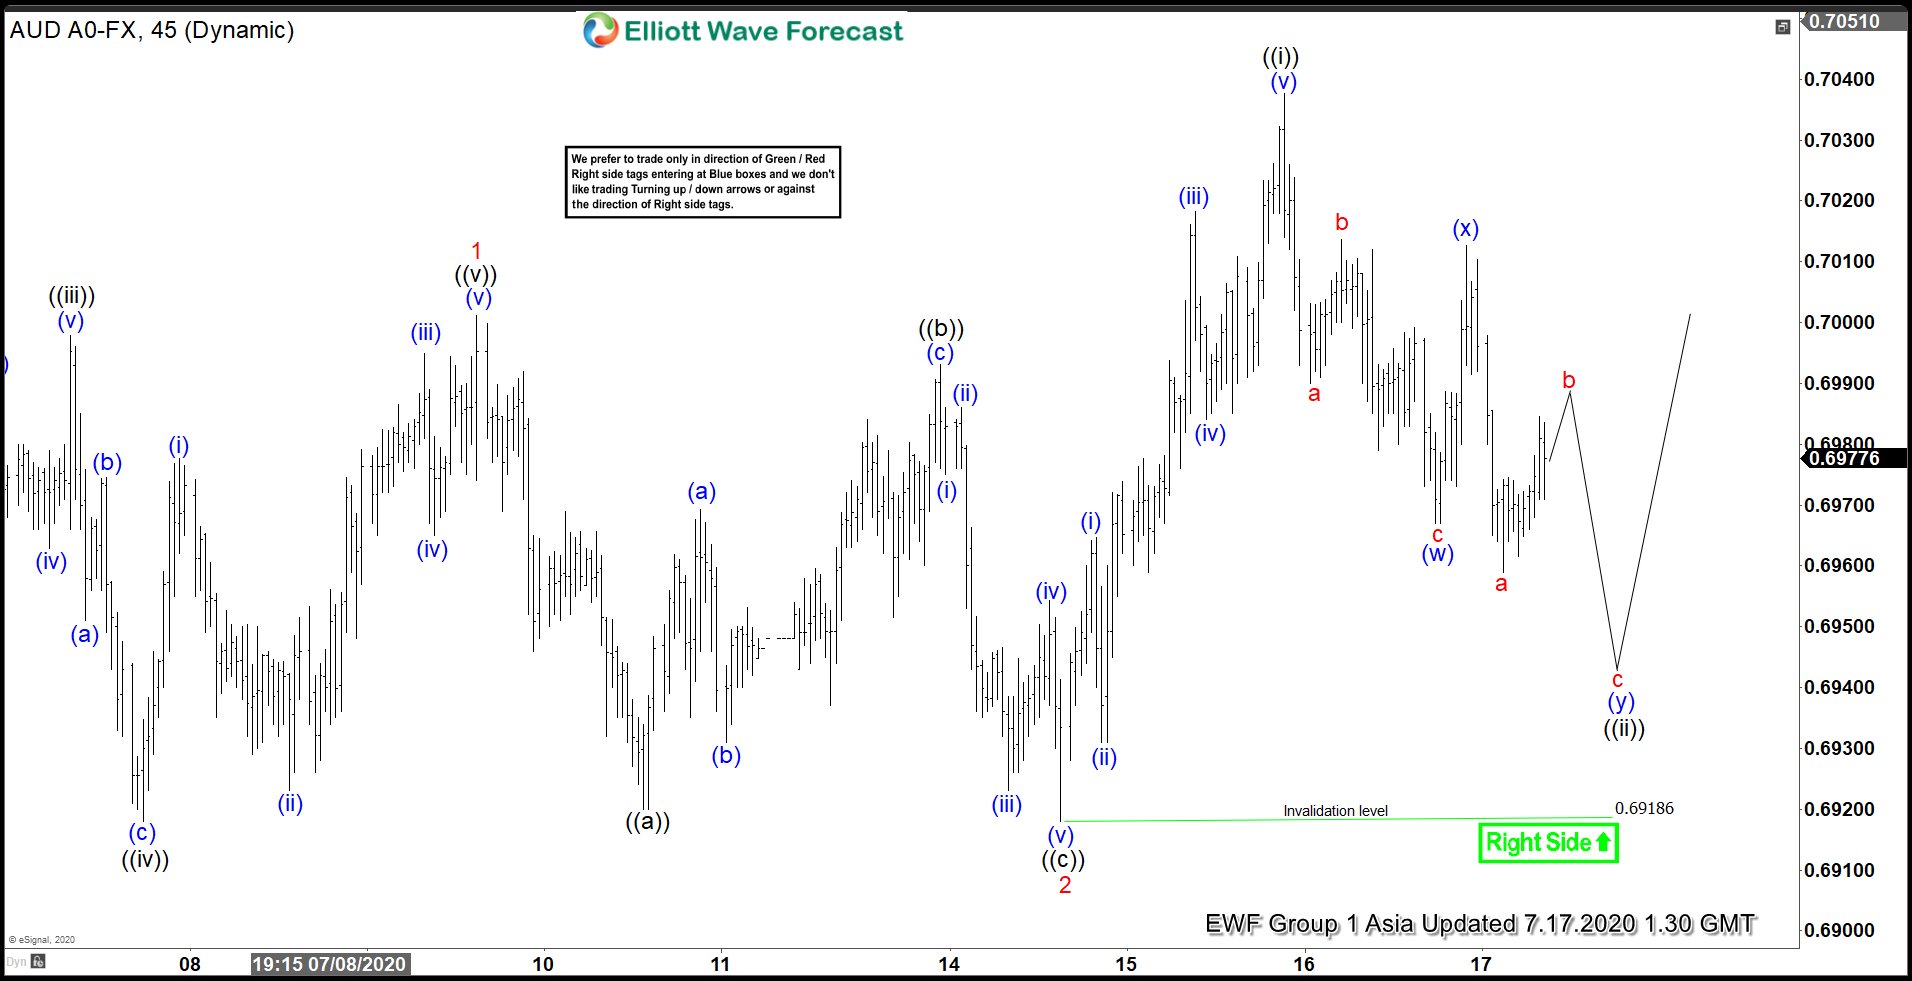
Elliott Wave View: AUDUSD Remain Supported
Read MoreAUDUSD rallied higher from July 14 low and broke above July 9 high. While above that low, expect dips to find support in 3, 7, or 11 swings for more upside.