
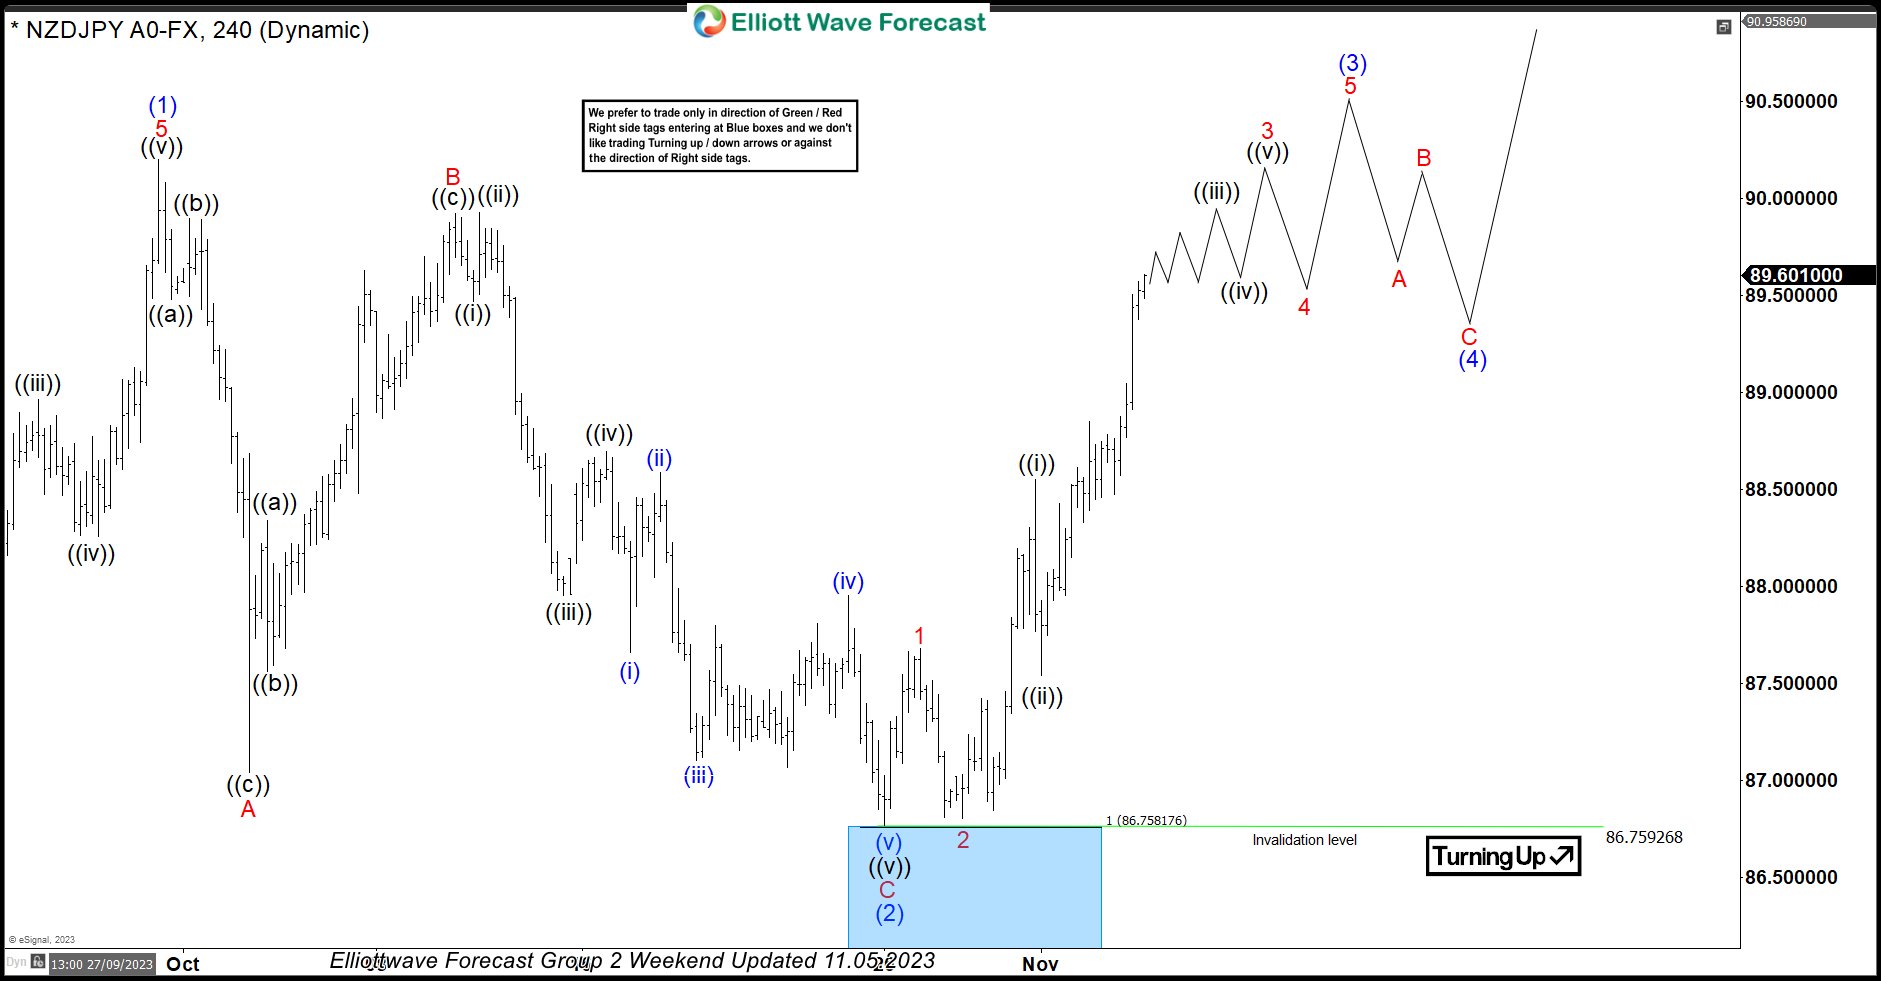
In this technical blog, we will look at the past performance of the 4-hour Elliott Wave Charts of NZDJPY. In which, the rally from 24 March 2023 low unfolded as an impulse sequence and showed a higher high sequence. Therefore, we knew that the structure in NZDJPY is incomplete to the upside & should extend higher. So, […]
-
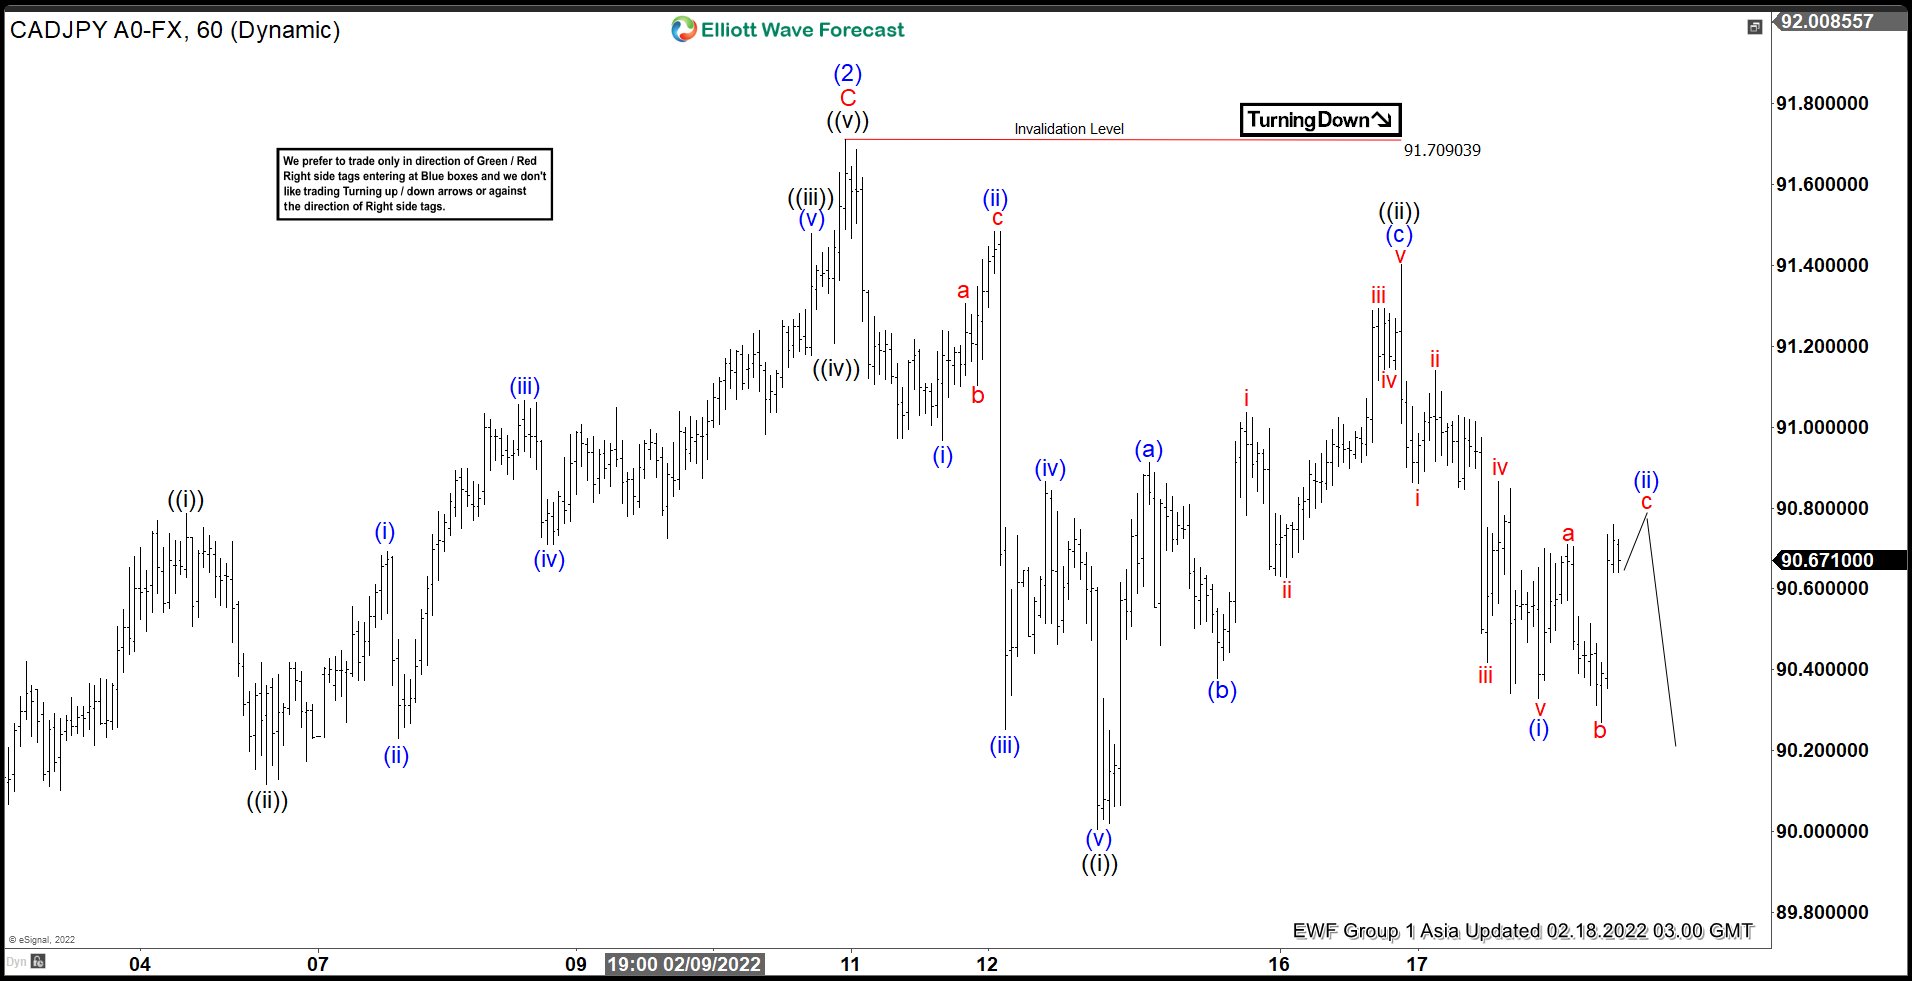
Elliott Wave View: CADJPY Looking for Further Downside
Read MoreCADJPYn is looking to extend lower in an impulsive structure. This article and video look at the Elliott Wave path of the pair.
-
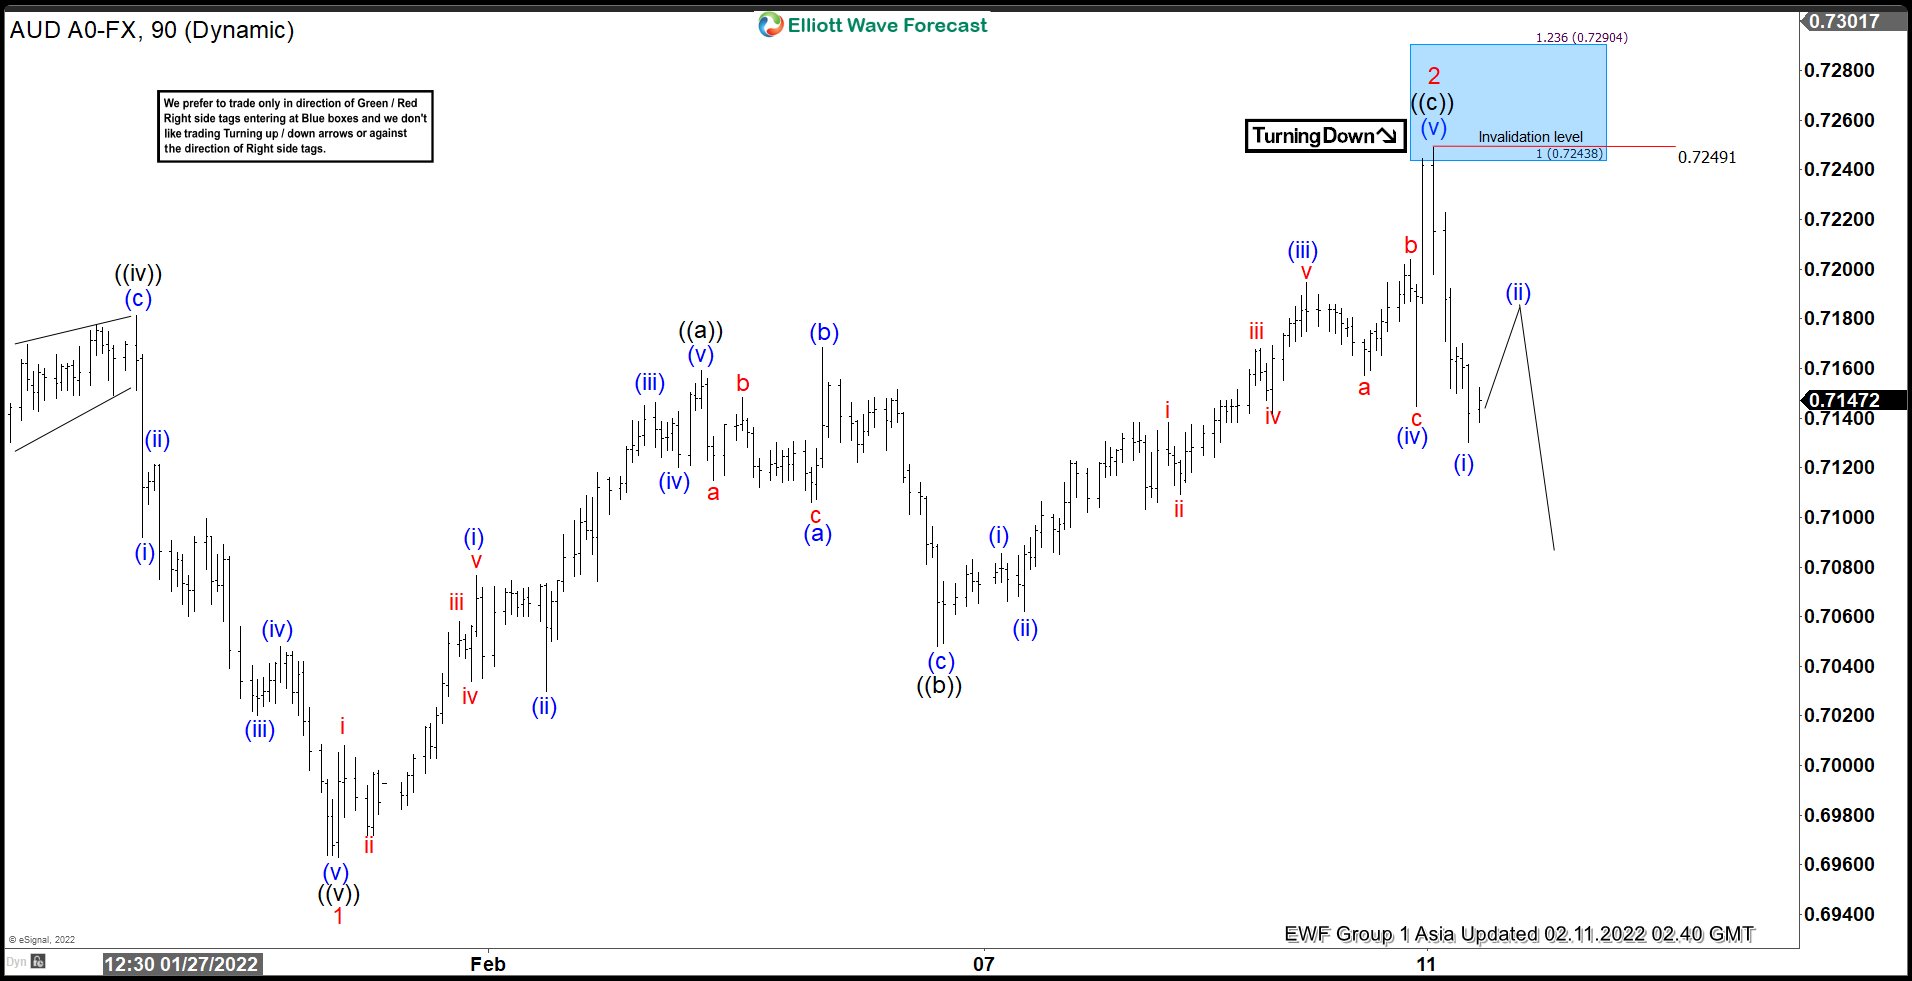
AUDUSD Selling The Bounce At Extreme Area
Read MoreIn this technical blog, we will look at the past performance of 1 hour Elliott Wave Charts of AUDUSD. In which, the decline from 13 January 2022 high unfolded as an impulse sequence and showed a lower low sequence. Therefore, we knew that the structure in AUDUSD is incomplete to the downside & should see more weakness. […]
-
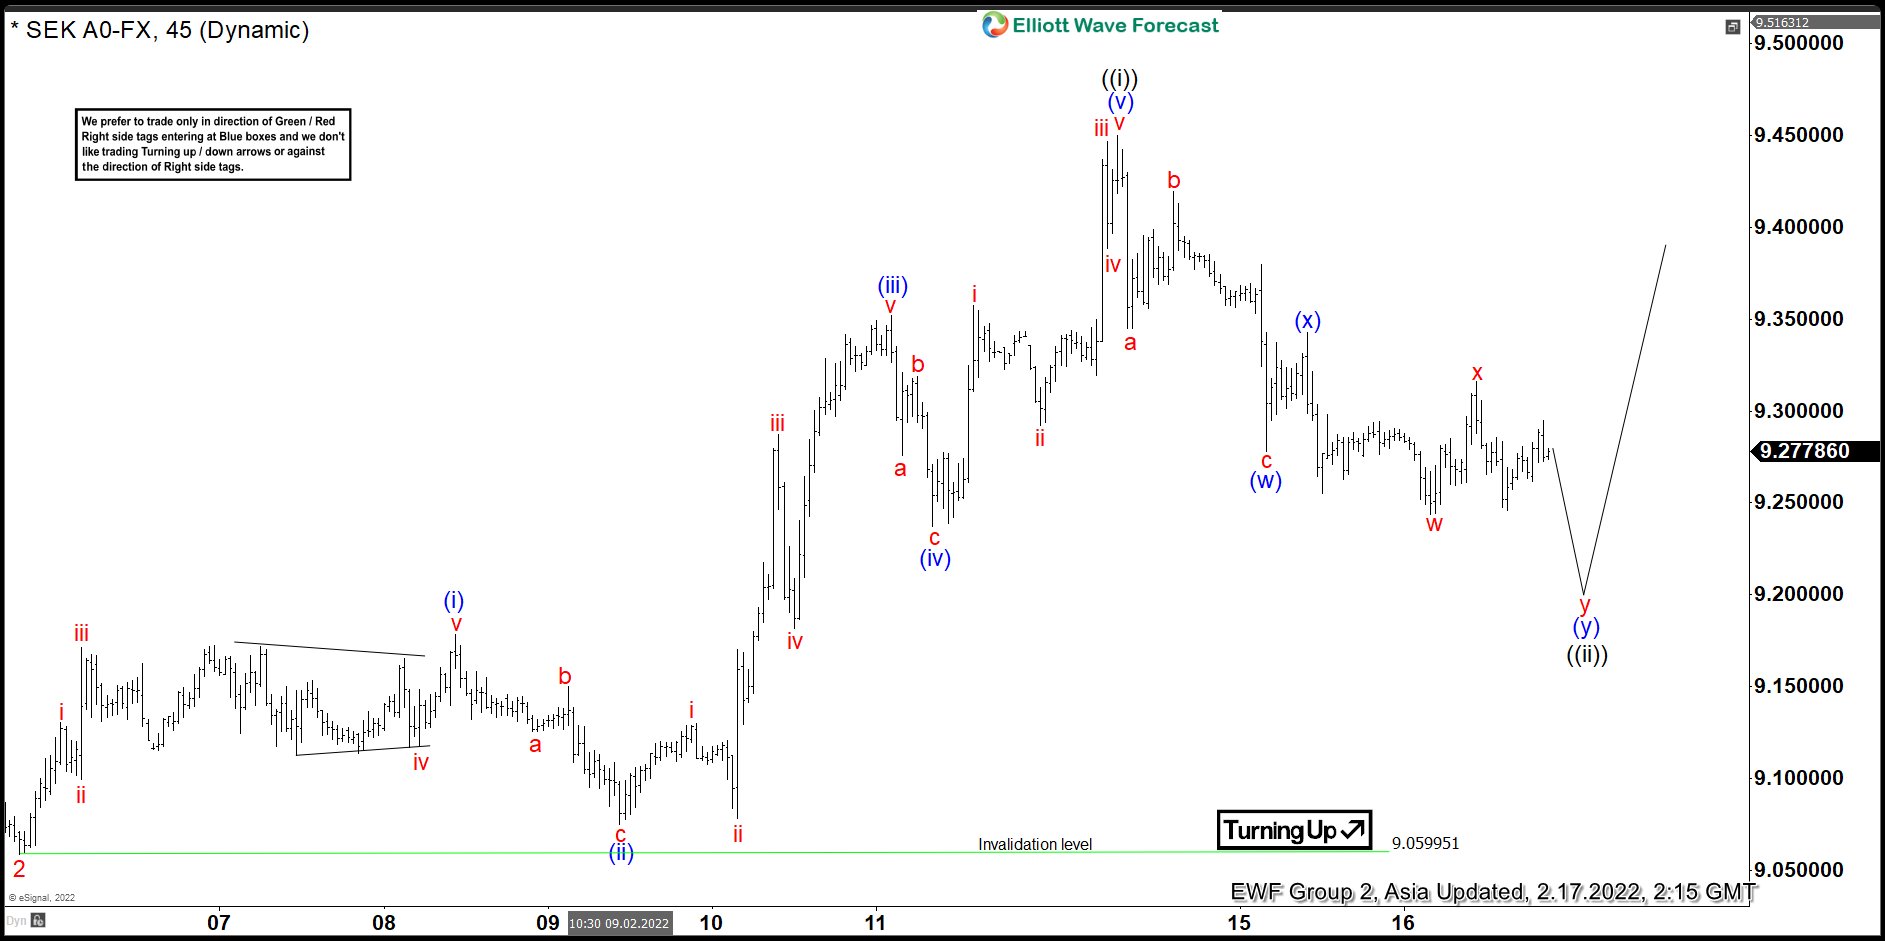
Elliott Wave View: USDSEK Looking for Another Leg Higher
Read MoreUSDSEK is correcting cycle from February 4 low before the next leg higher. This article and video look at the Elliott Wave path.
-
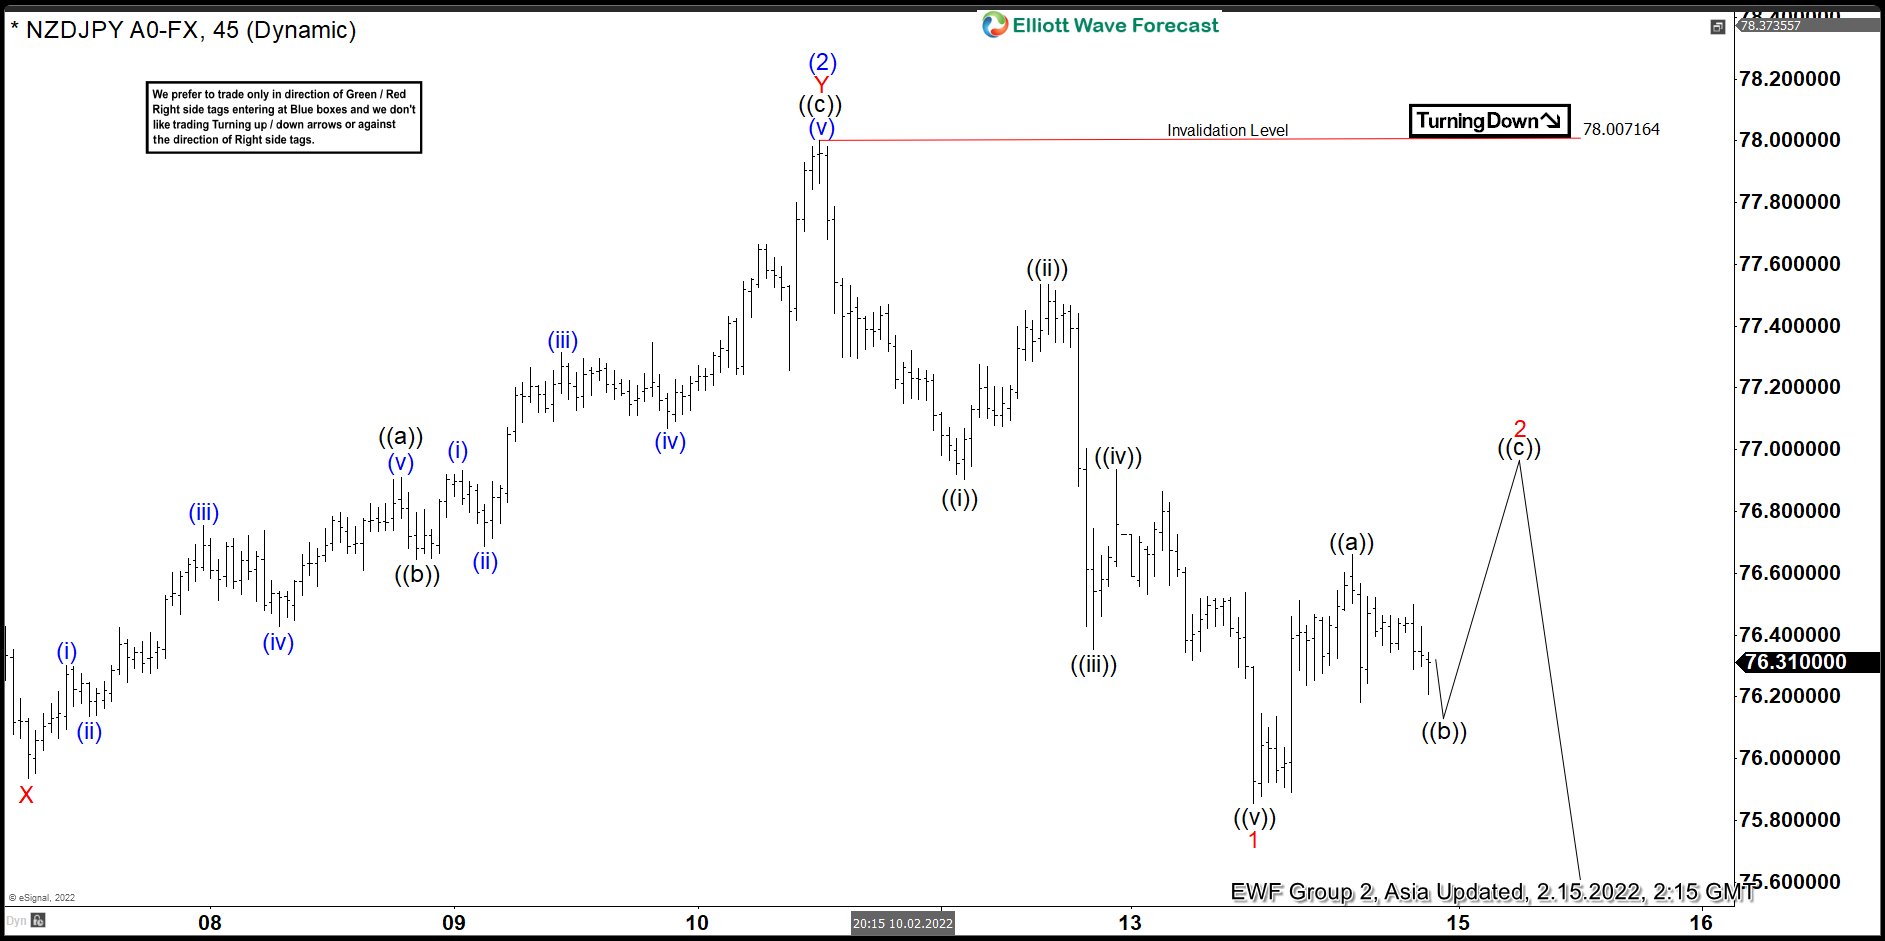
Elliott Wave View: NZDJPY Turns Lower After 3 Waves Rally
Read MoreShort term Elliott Wave view in NZDJPY suggests that decline from January 5, 2022 peak is unfolding as a 5 waves impulse structure. Down from January 5 peak, wave (1) ended at 75.24 on January 28 and rally to 78 ended wave (2) on February 10. Internal subdivision of wave (2) unfolded as a double […]
-
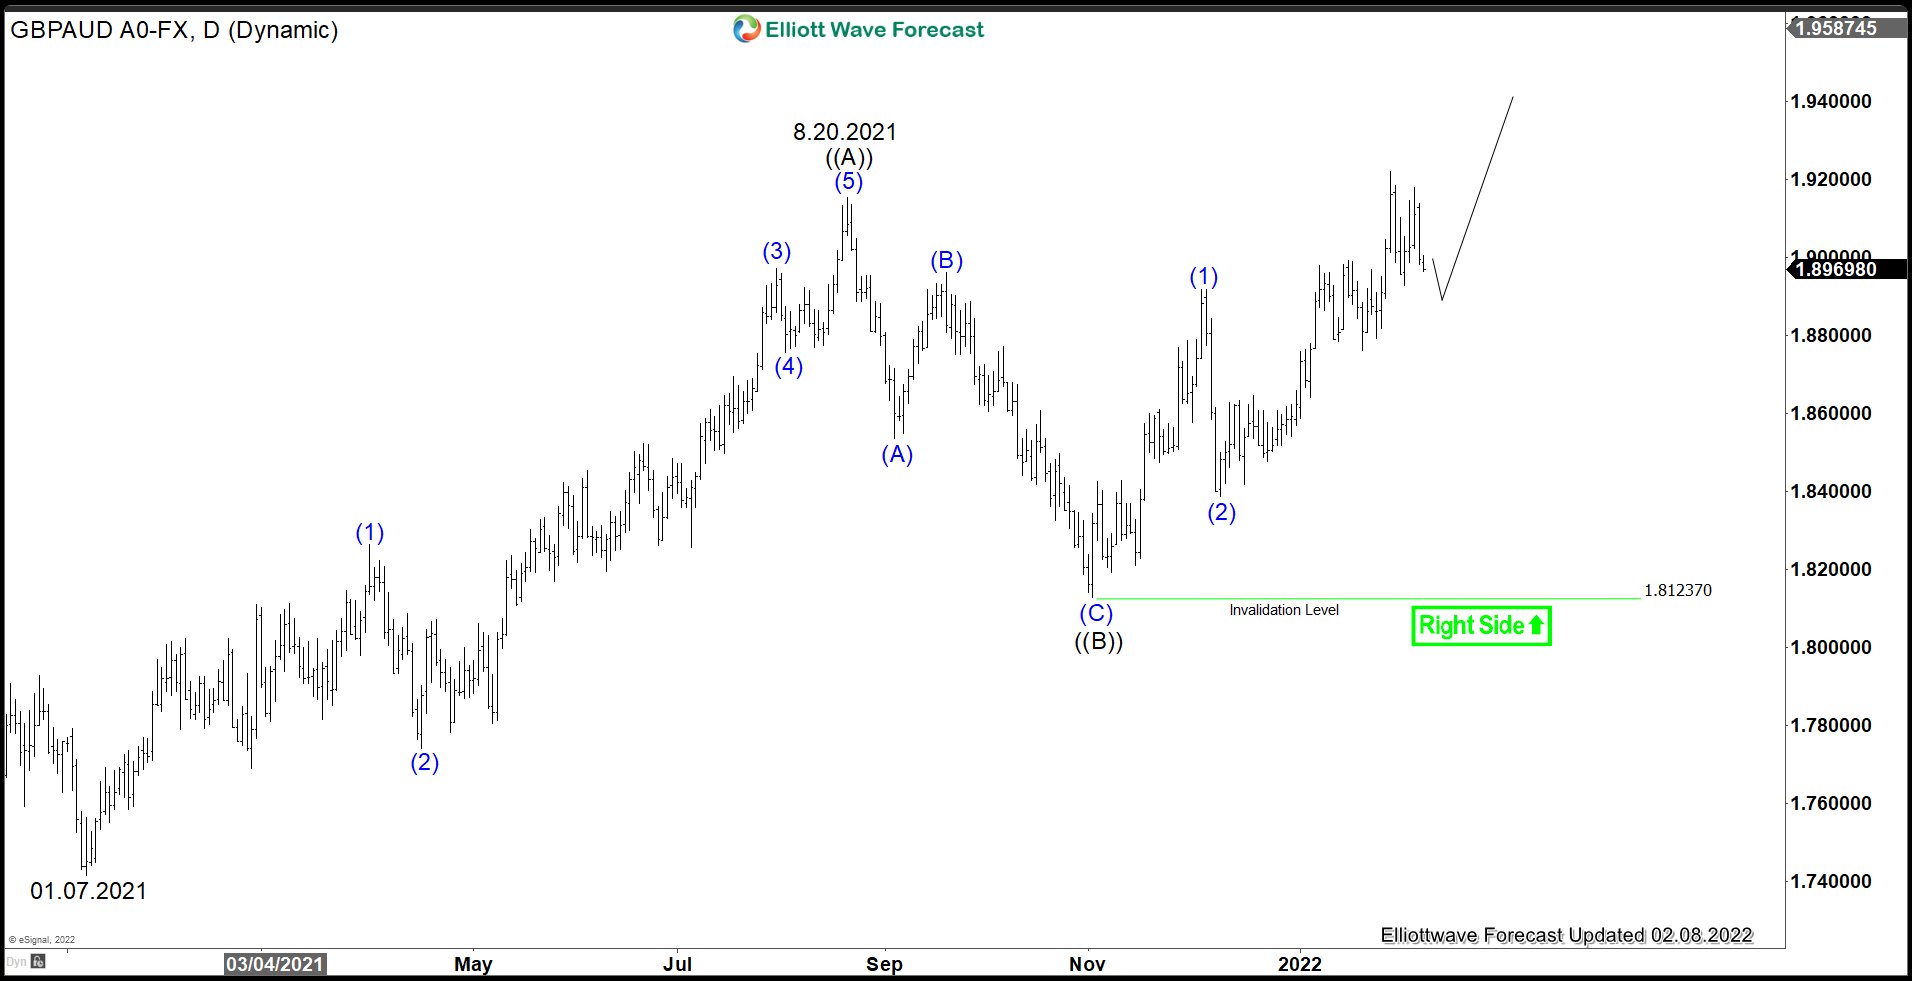
GBPAUD Bullish Sequence Favors More Upside
Read MoreGBPAUD has found bid due to the divergence in the monetary policy between RBA and BOE. Bank of England (BOE) this year has hiked interest rate twice to fight against inflation. However, BOE indicates that it may still need to hike a few more times this year before it stops. This should take interest rates […]
-
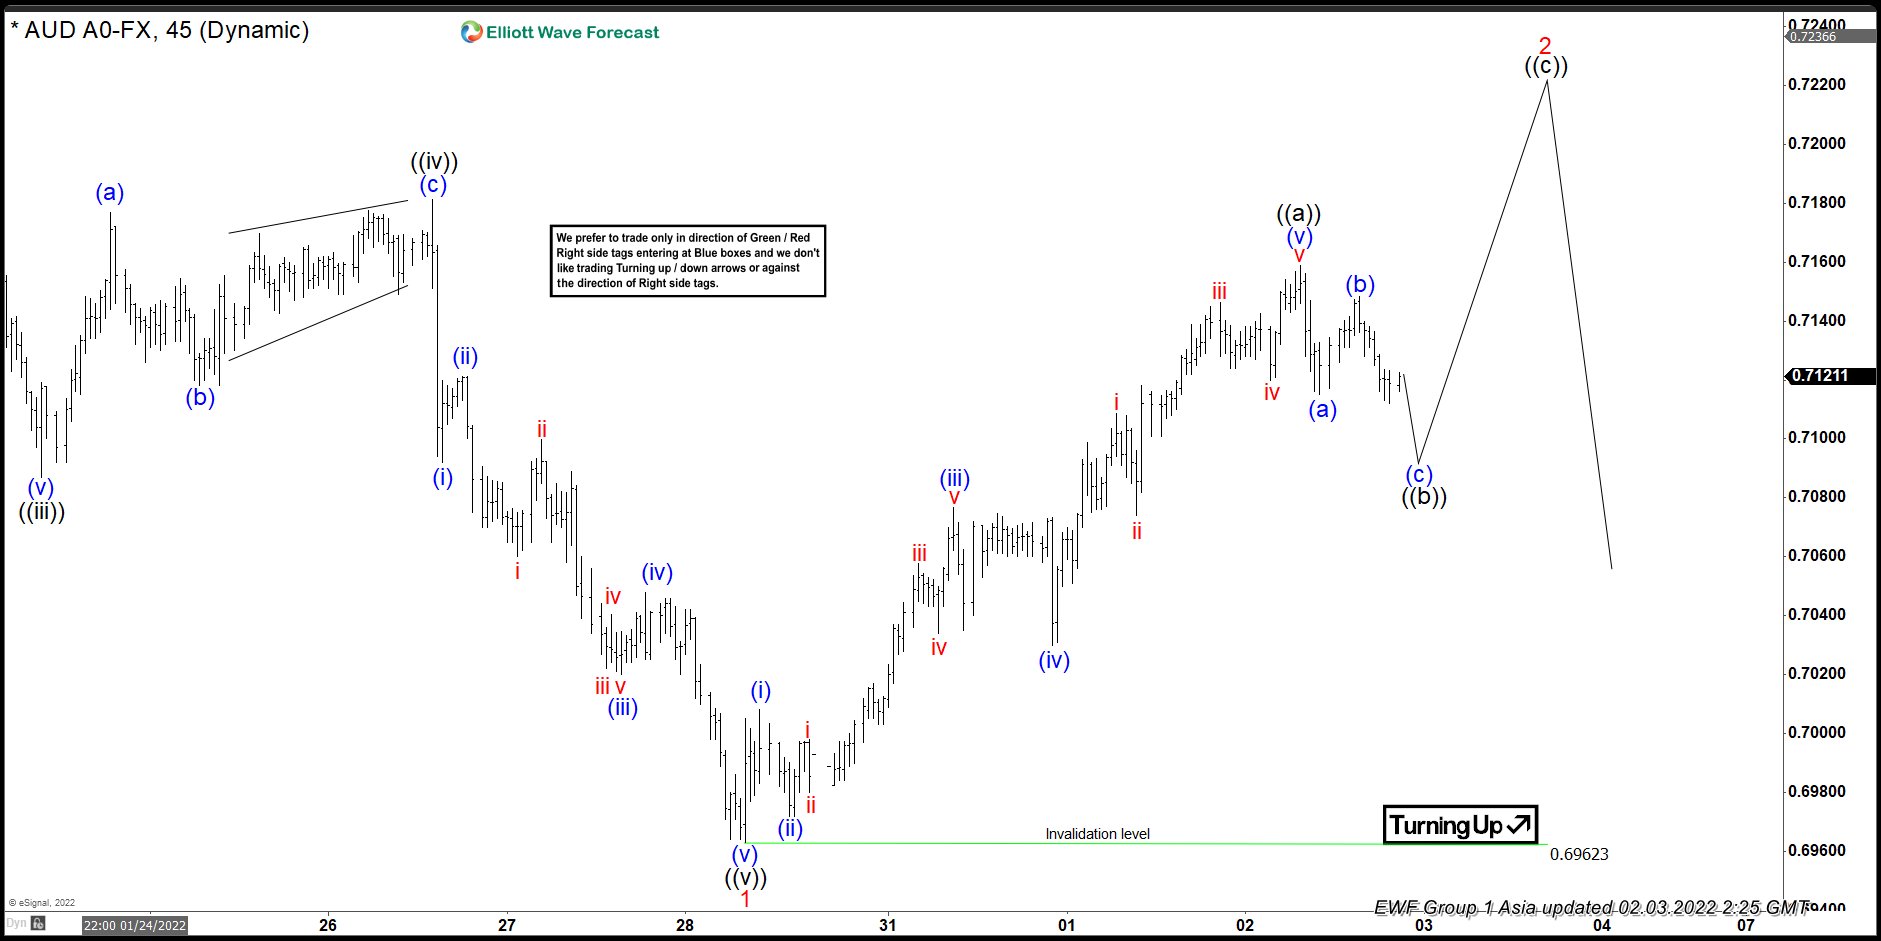
AUDUSD Elliott Wave View: Bounce Can Extend Higher
Read MoreAUDUSD the bounce from January 28 low is unfolding as a zigzag structure & expected to extend higher. This article and video look at the Elliott Wave path.