
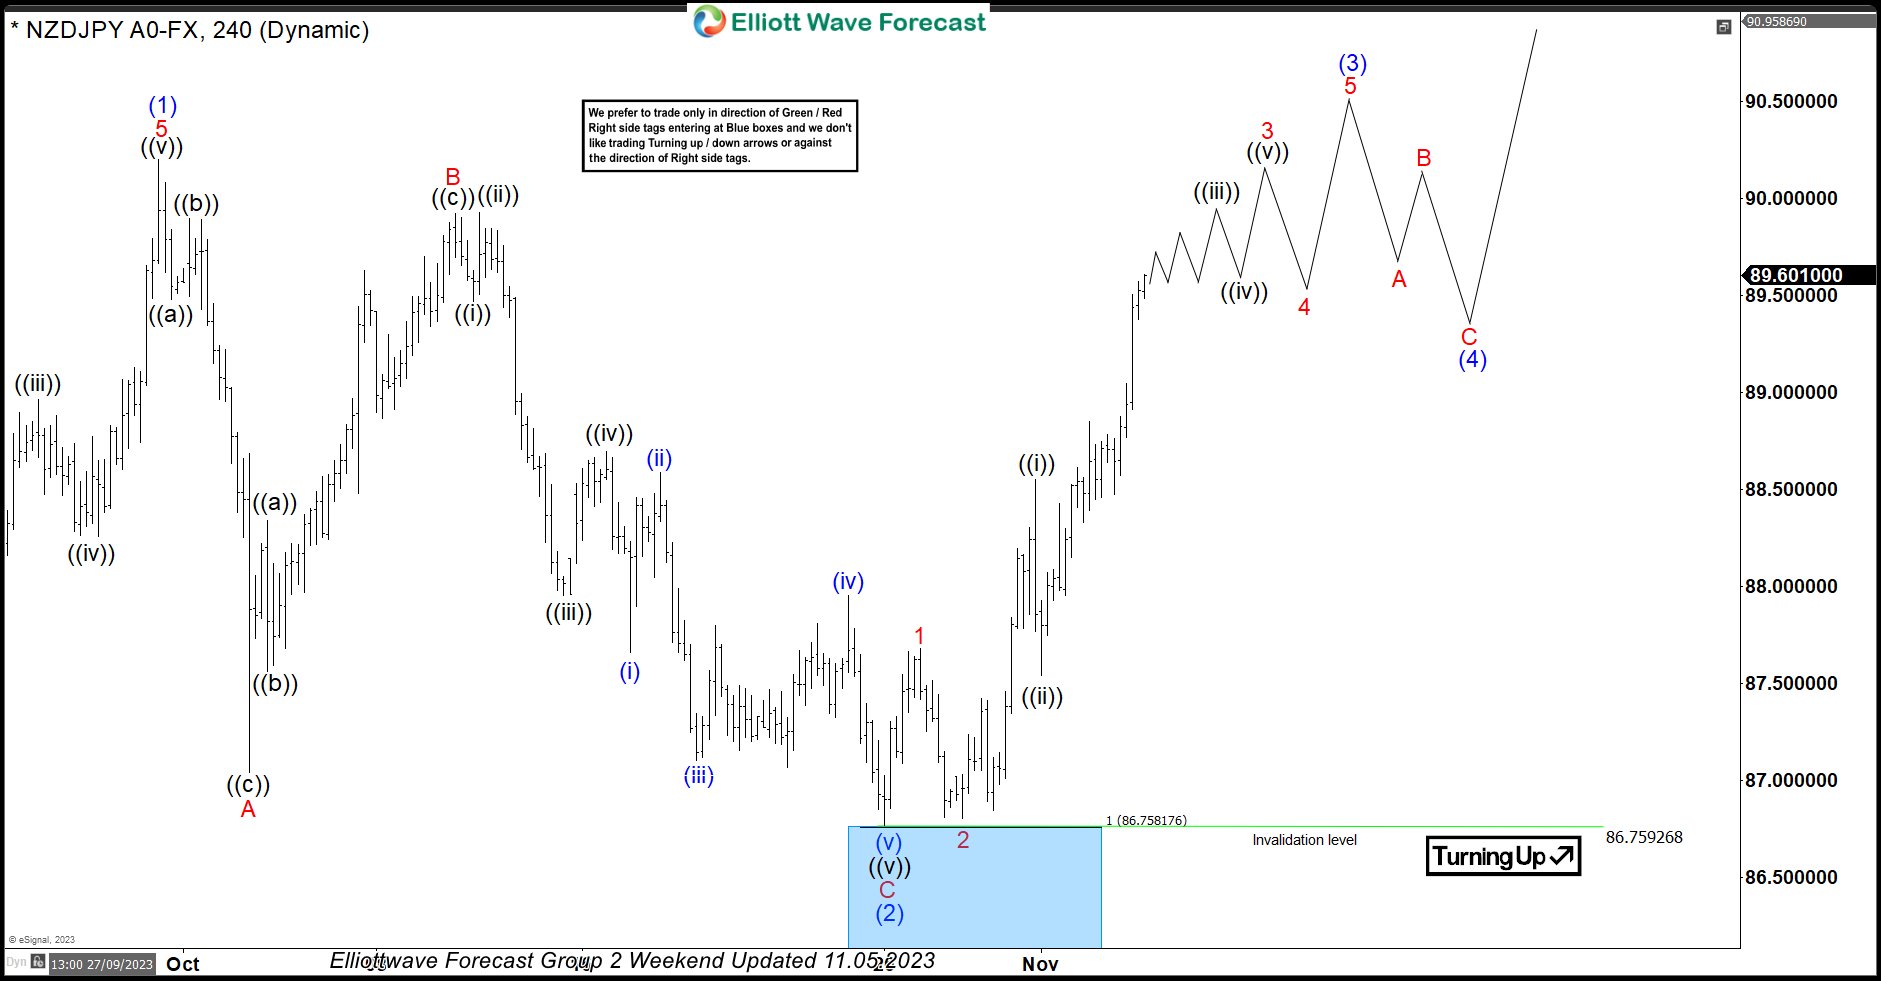
In this technical blog, we will look at the past performance of the 4-hour Elliott Wave Charts of NZDJPY. In which, the rally from 24 March 2023 low unfolded as an impulse sequence and showed a higher high sequence. Therefore, we knew that the structure in NZDJPY is incomplete to the upside & should extend higher. So, […]
-
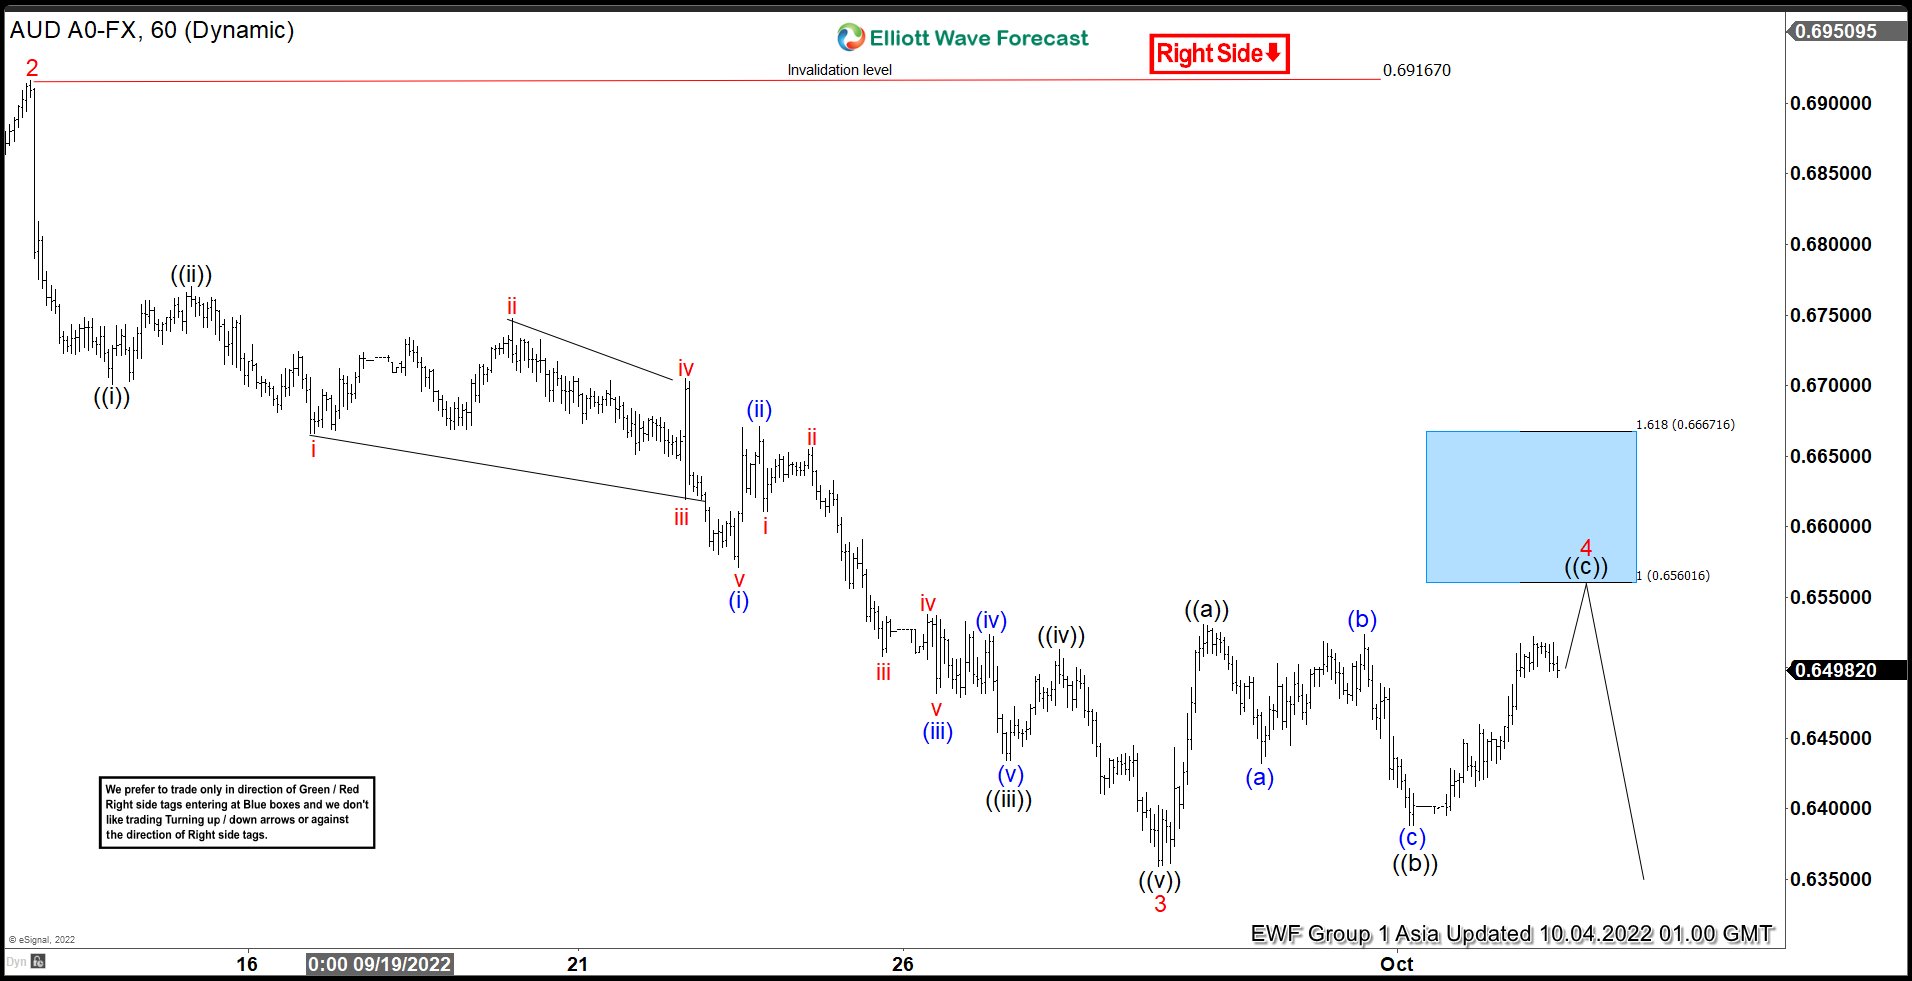
Elliott Wave View: AUDUSD Rally to Fail for More Downside
Read MoreAUDUSD shows incomplete 5 waves impulse from 8.11.2022 high calling for more downside. Rally should fail in 3, 7, 11 swing for further downside.
-

Elliott Wave View: EURUSD Near Term Further Downside Likely
Read MoreEURUSD cycle from 8.11.2022 high remains incomplete looking for further downside. This article and video look at the Elliott Wave path.
-
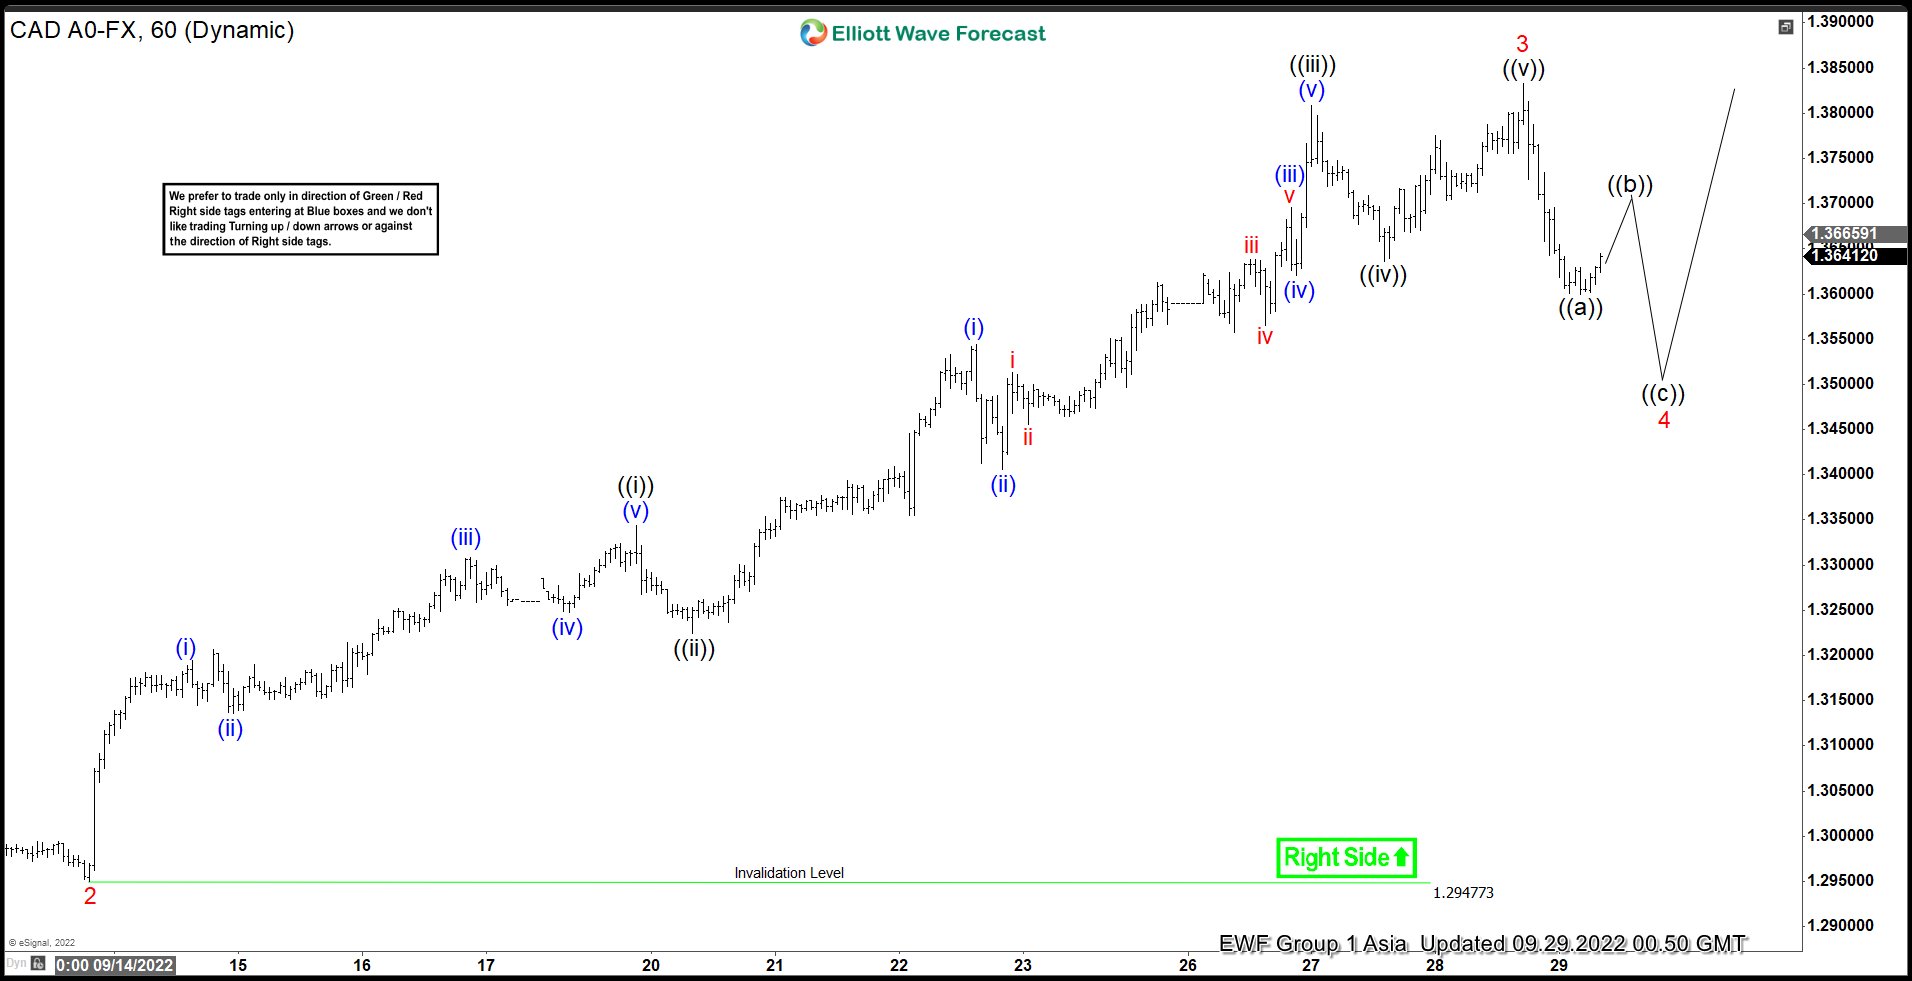
Elliott Wave View: Impulsive Rally in USDCAD Looks Incomplete
Read MoreShort term Elliott Wave view on USDCAD suggests cycle from 8.11.2022 low is in progress as a 5 waves impulse structure. Up from 8.11.2022 low, wave 1 ended at 1.3208 and pullback in wave 2 ended at 1.2954. Pair has resumed higher in wave 3 with internal subdivision in another 5 waves of lesser degree. […]
-
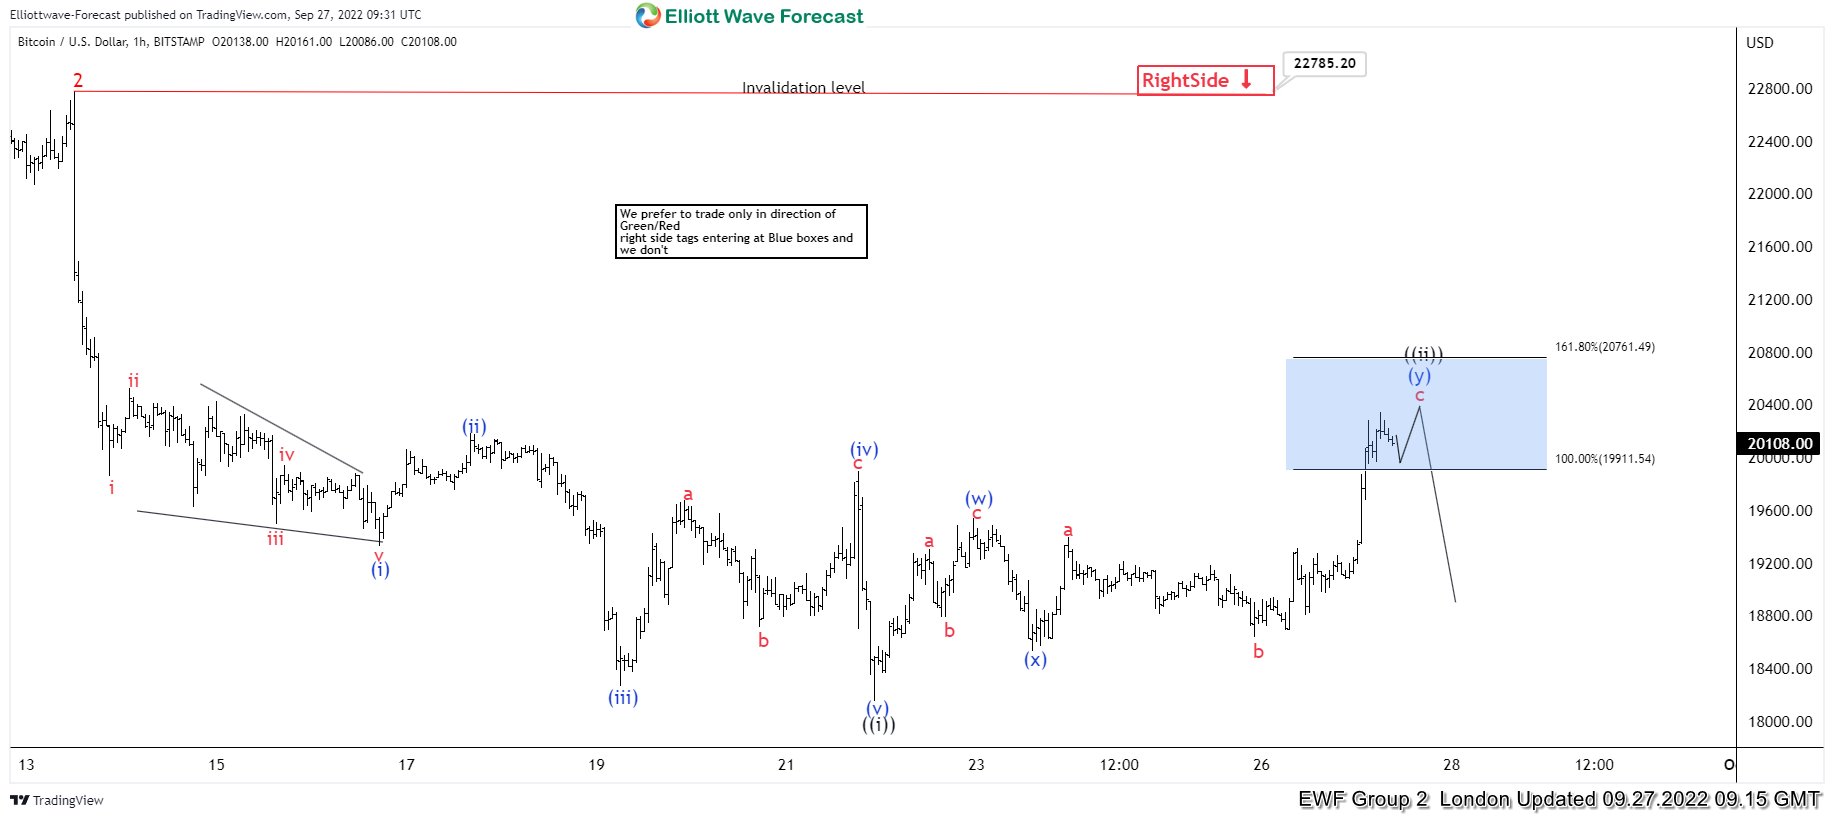
Bitcoin Reacting Lower From Elliott Wave Blue Box Area
Read MoreIn this blog, we take a look at the past performance of Bitcoin charts. In which, the pair provided a selling opportunity at the blue box area.
-
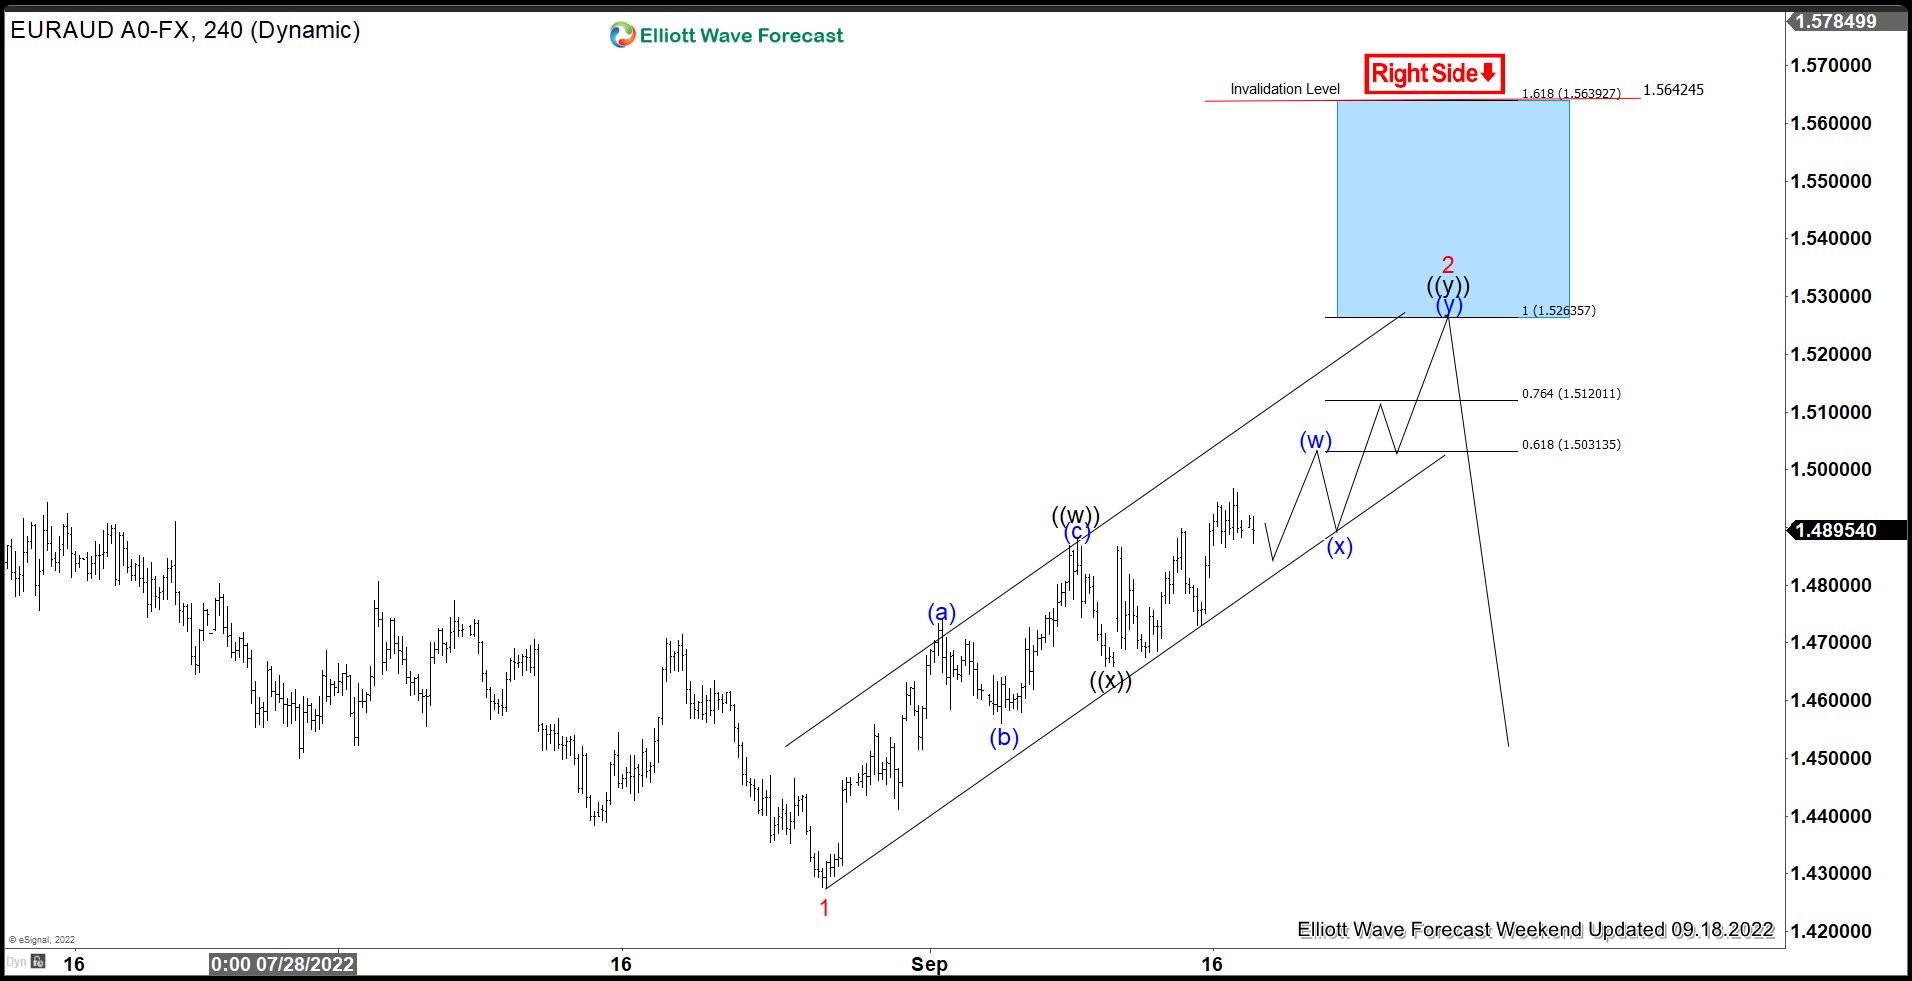
EURAUD Shows Bearish Sequence Favoring Downside
Read MoreThe Euro continues to slide against many other major currencies after Russia stopped the gas supplies. The deepening energy crisis causes fear of a recession in the Euro area. Europe has tried to diversify its energy sources and build up reserves, but it’s not possible to totally avert the hit to the economy. In the […]
-
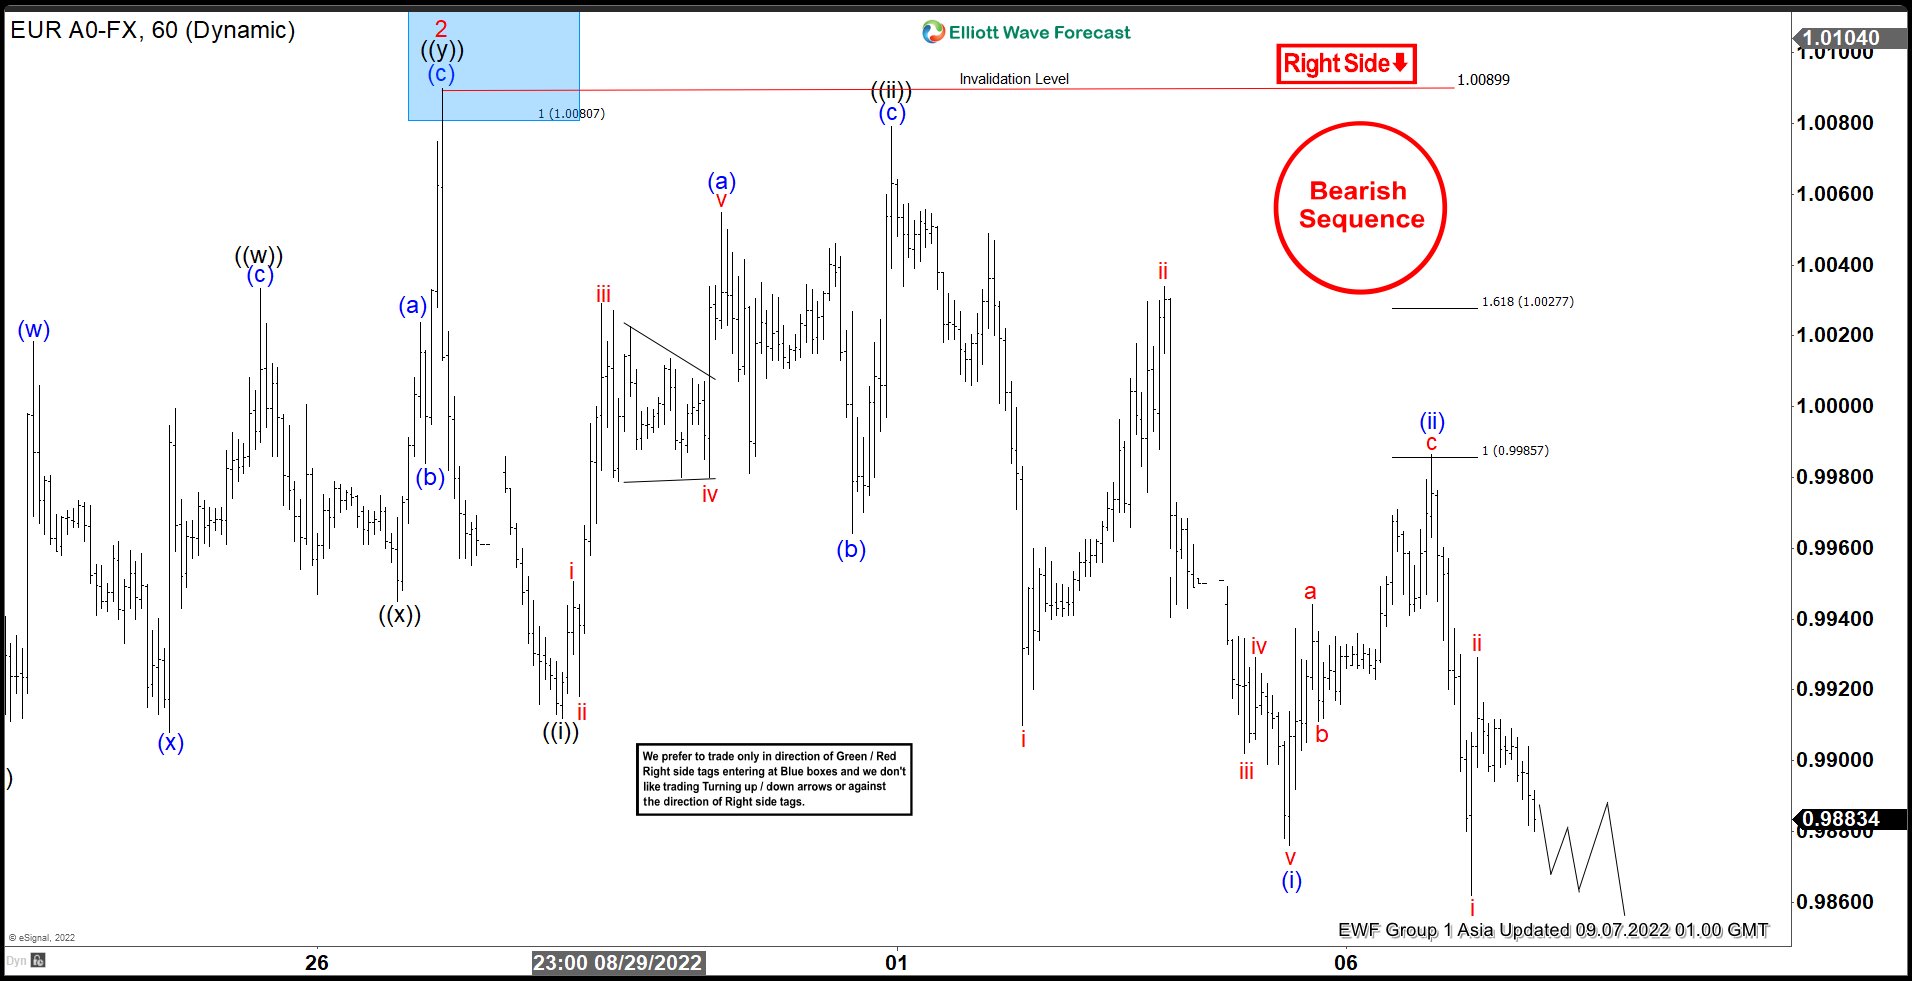
Elliott Wave View: EURUSD Should Continue to Extend Lower
Read MoreEURUSD shows bearish sequence from 8.10.2022 high favoring further downside. This article and video look at the Elliott Wave path.