
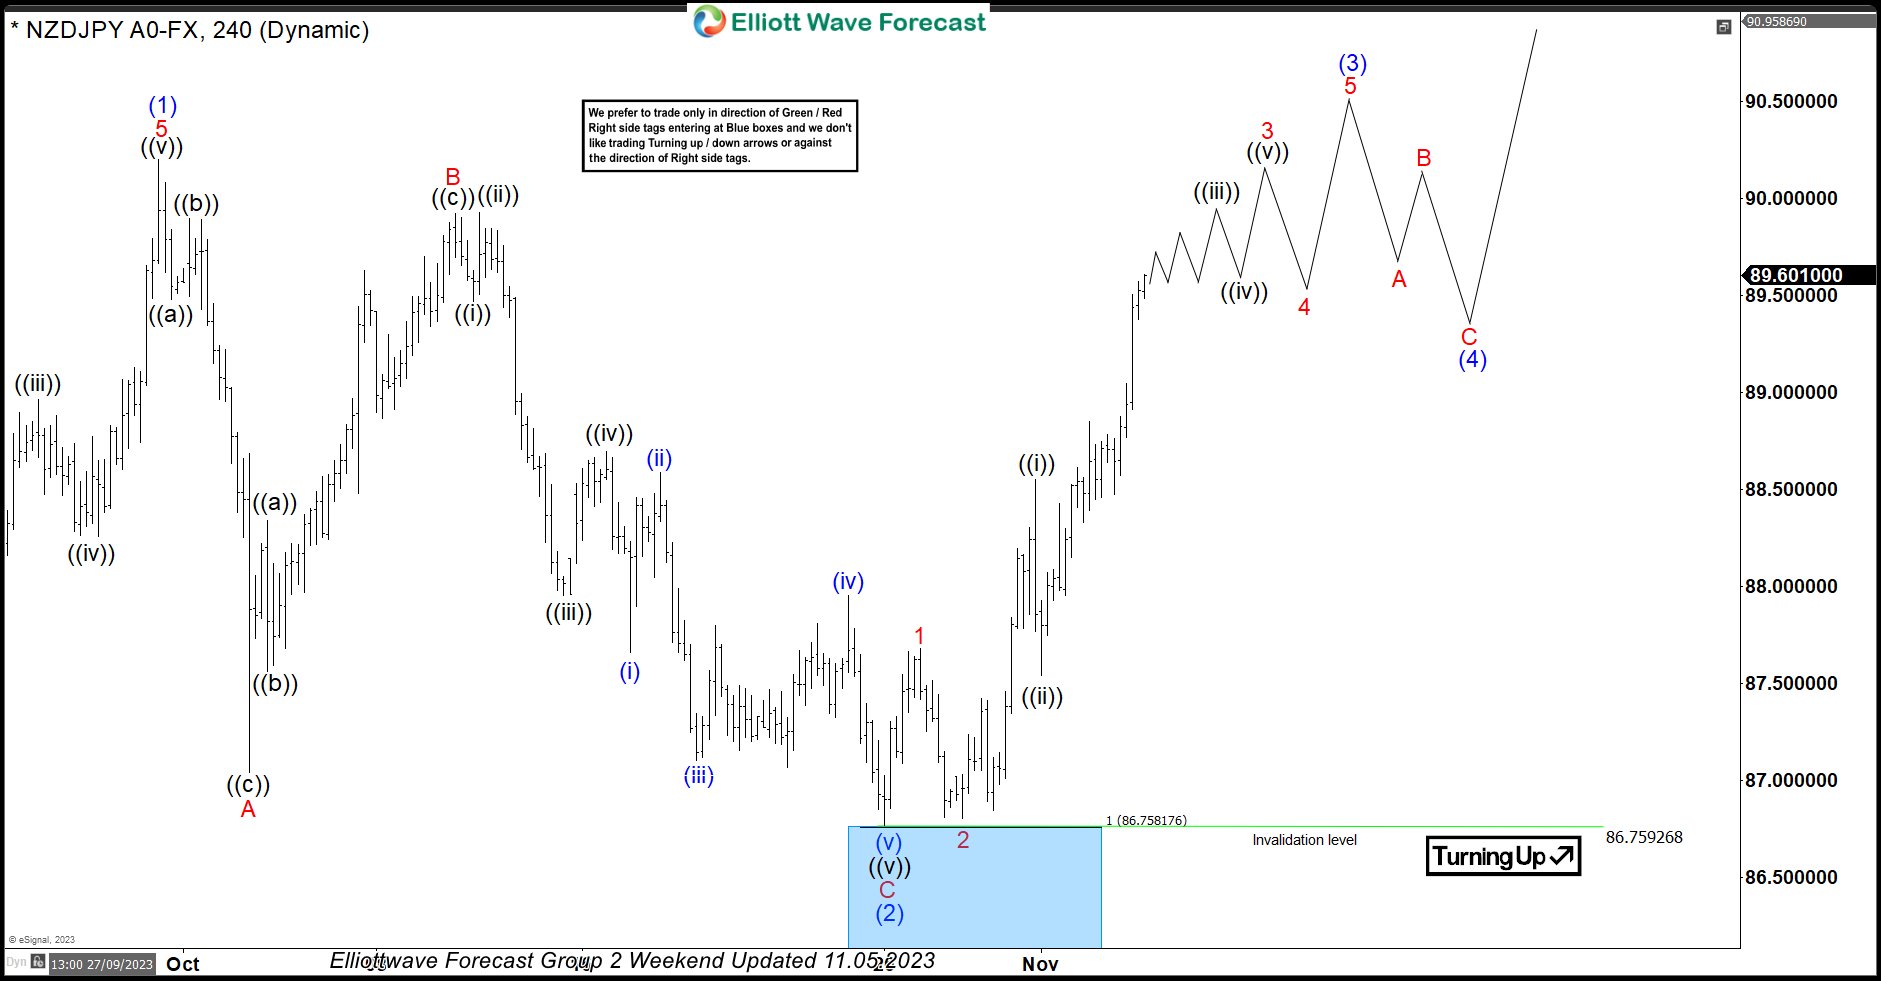
In this technical blog, we will look at the past performance of the 4-hour Elliott Wave Charts of NZDJPY. In which, the rally from 24 March 2023 low unfolded as an impulse sequence and showed a higher high sequence. Therefore, we knew that the structure in NZDJPY is incomplete to the upside & should extend higher. So, […]
-
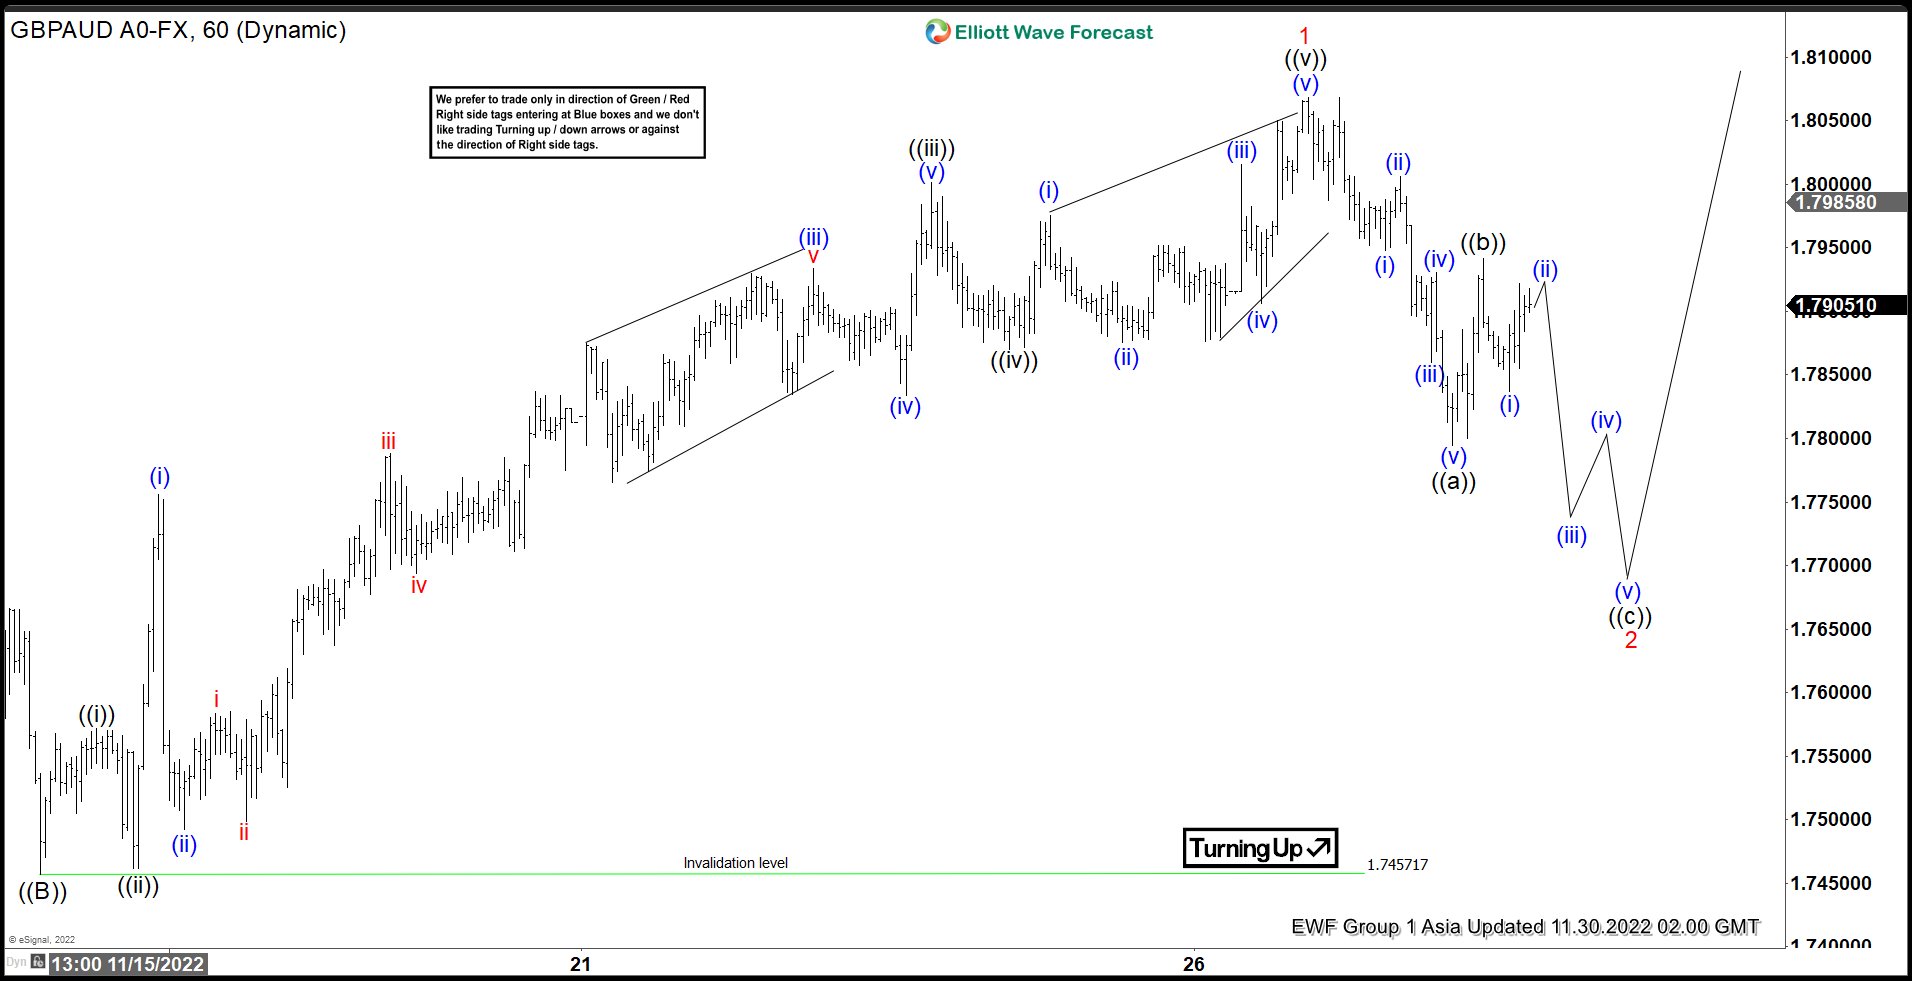
Elliott Wave View: Larger Degree Rally in GBPAUD
Read MoreShort term Elliott Wave View in GBPAUD suggests the rally from 9.26.2022 low is unfolding as a zigzag Elliott Wave structure. Up from 9.26.2022 low, wave ((A)) ended at 1.8199 and pullback in wave ((B)) ended at 1.7456. Pair resumes higher again in wave ((C)) which subdivides into 5 waves impulse Elliott Wave structure in […]
-

The Best Trading Hours in the Forex Market
Read MoreWhat is a Forex Market? The foreign exchange (also known as forex or FX) market is a global marketplace for exchanging currencies. The Forex Market Basics Forex refers to foreign exchange and forex trading is about the exchange of currencies The forex market is essentially the global marketplace upon which all the exchanges of these […]
-
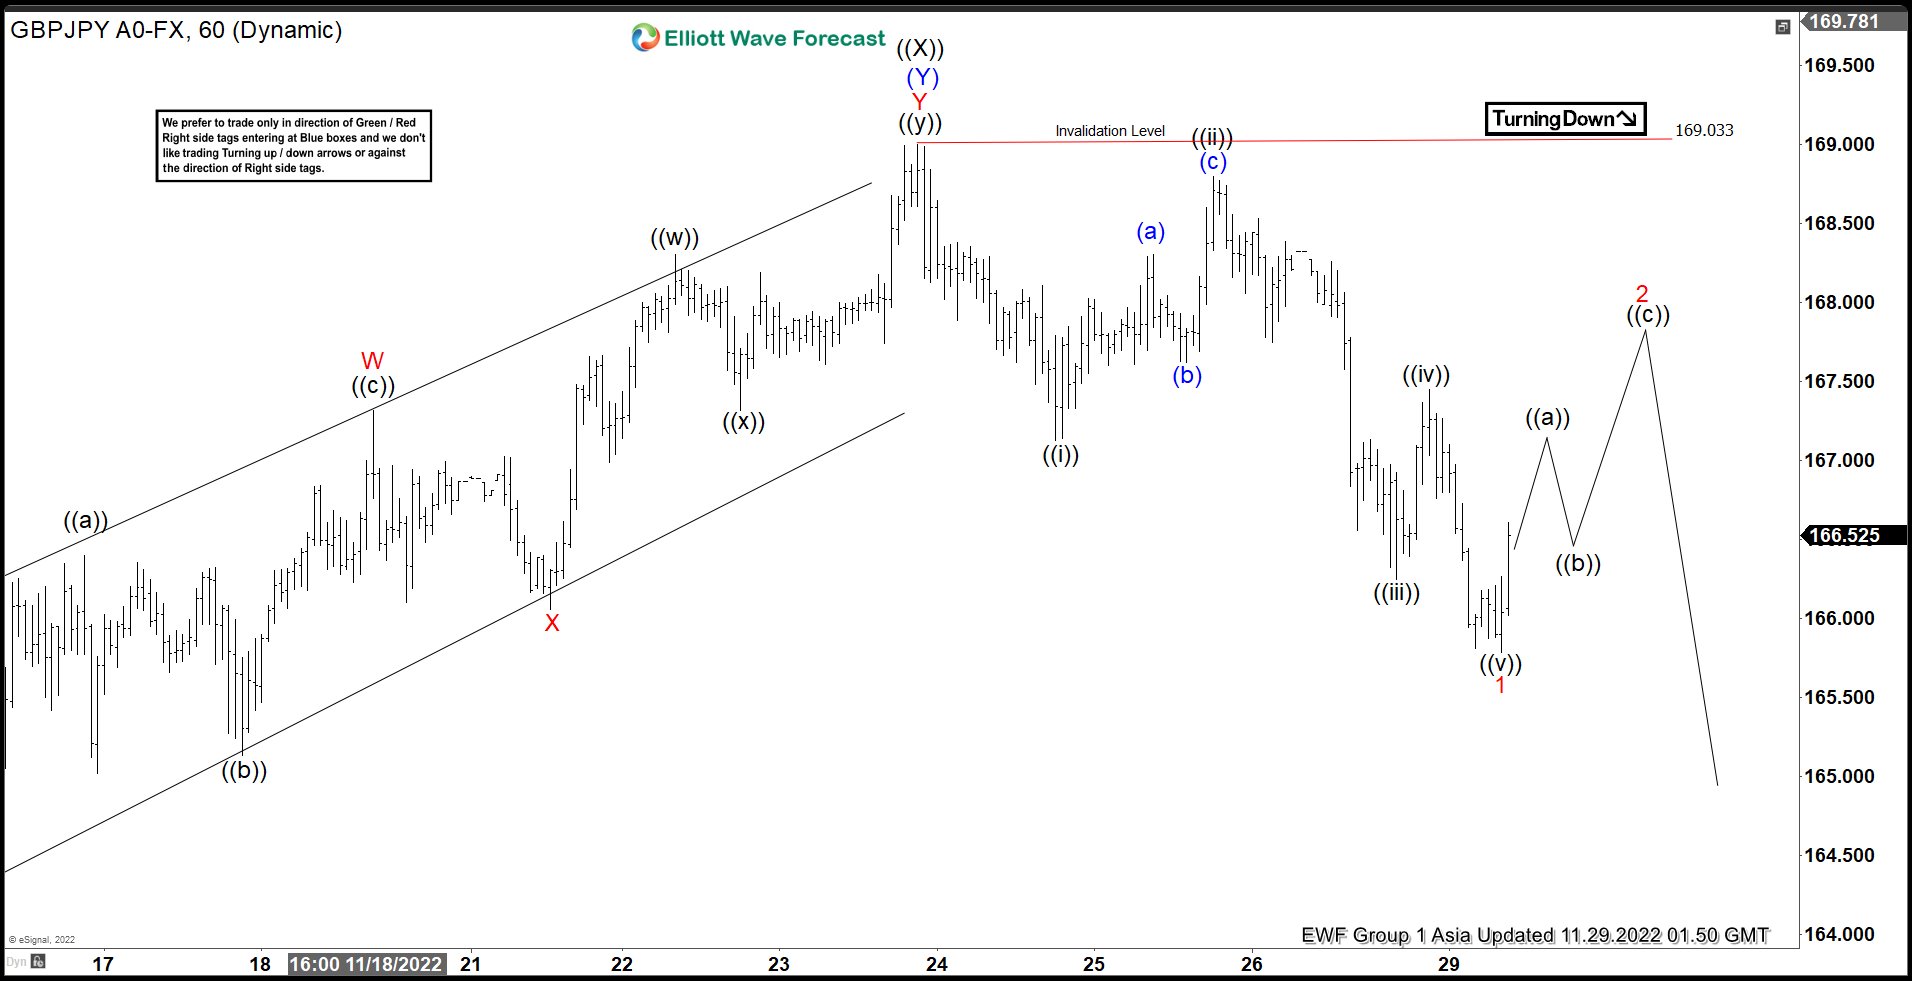
Elliott Wave View: GBPJPY Doing Double Correction
Read MoreGBPJPY shows a 5 waves move from 11.23.2022 high looking for further downside. This article and video look at the Elliott Wave path.
-
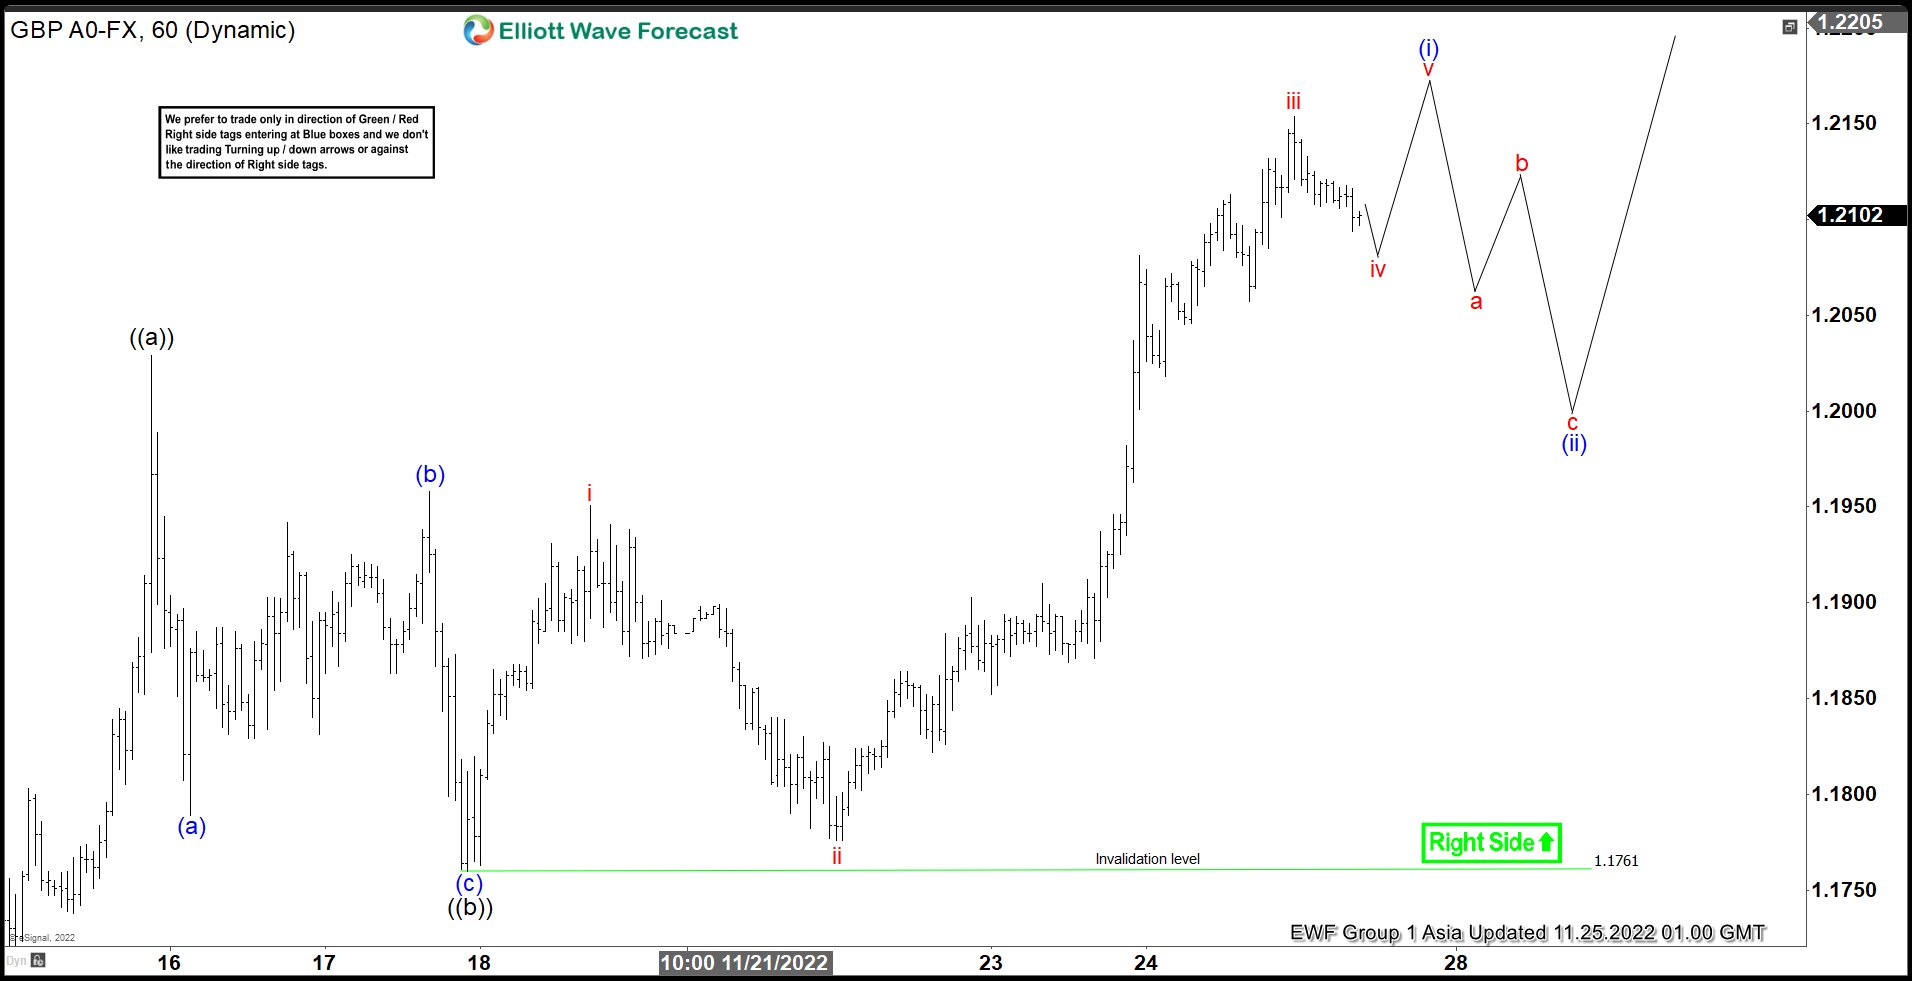
Elliott Wave View: GBPUSD Near Term Remains Bullish
Read MoreShort term Elliott Wave View in GBPUSD suggests that the cycle from 11.4.2022 low is unfolding as a zigzag Elliott Wave structure. Up from 11.4.2022 low, wave ((a)) ended at 1.2029. Pullback in wave ((b)) unfolded as a zigzag structure in lesser degree. Down from wave ((a)), wave (a) ended at 1.1789 and rally in […]
-
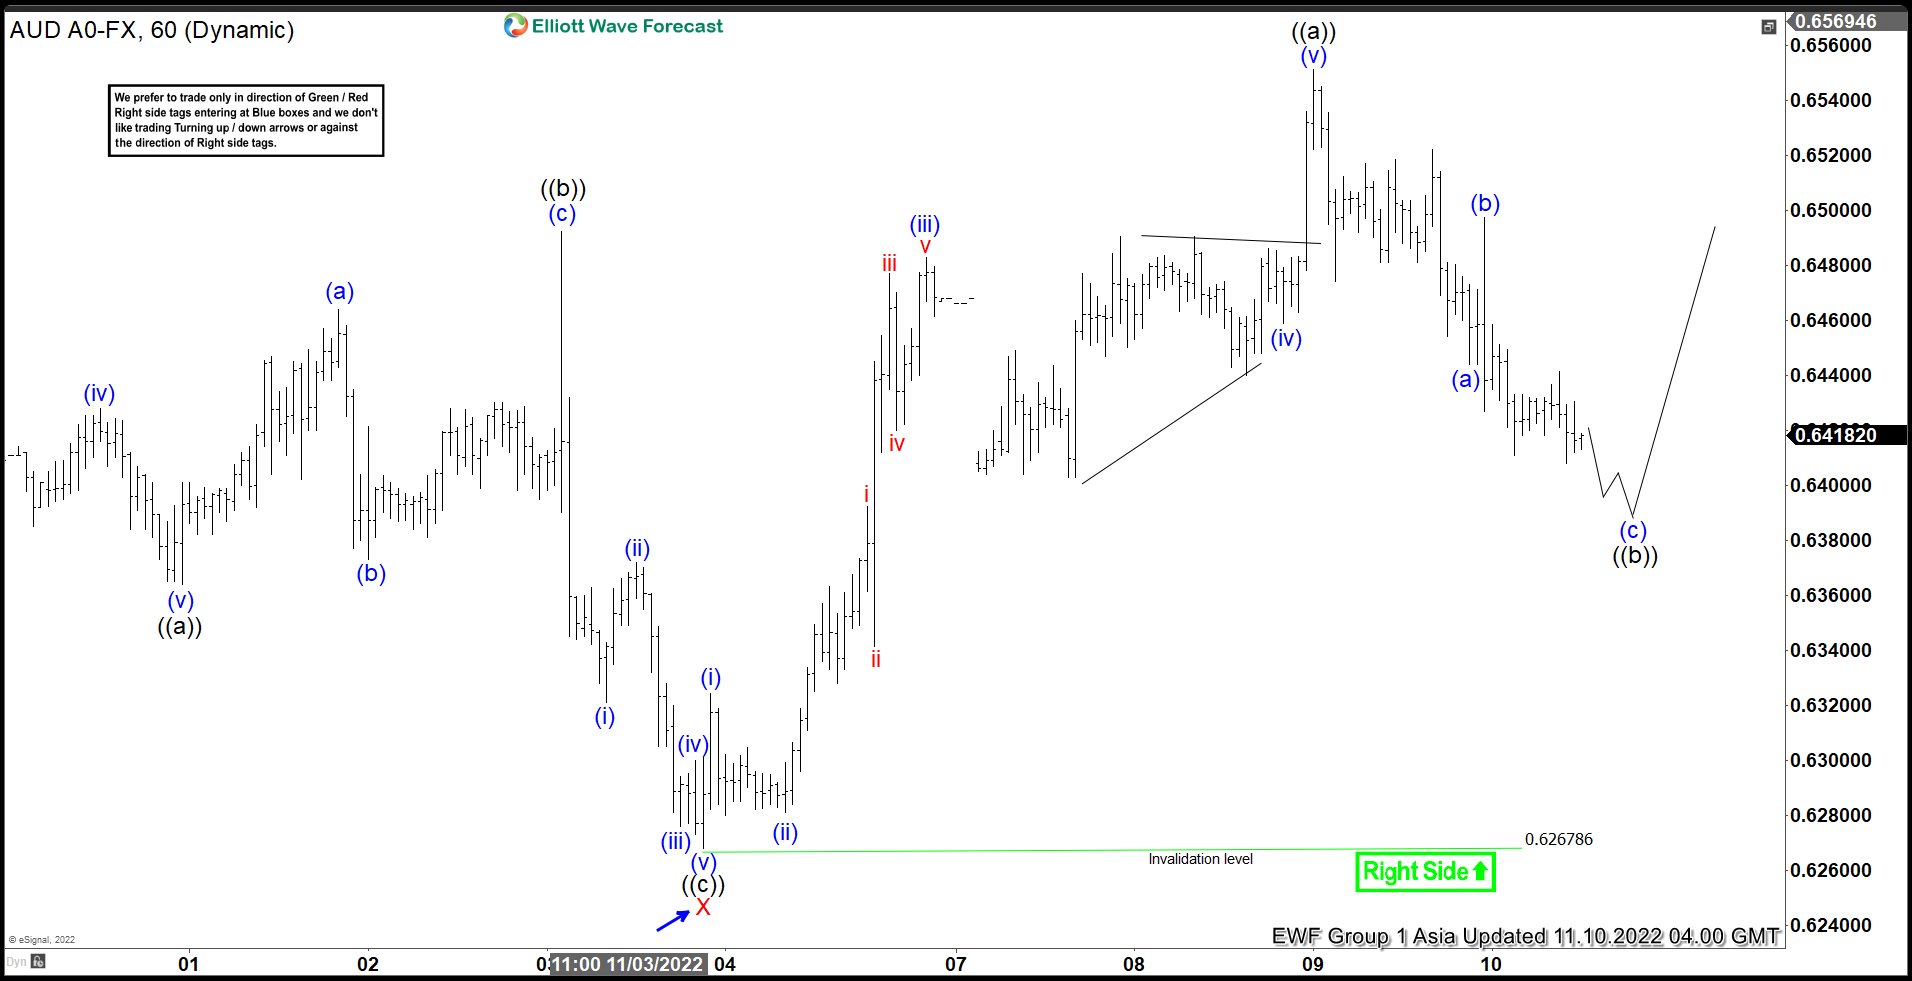
Elliott Wave View: AUDUSD Looking to Rally in Double Correction
Read MoreAUDUSD shows bullish sequence from 10.13.2022 low favoring more upside. This article and video look at the Elliott Wave path.
-
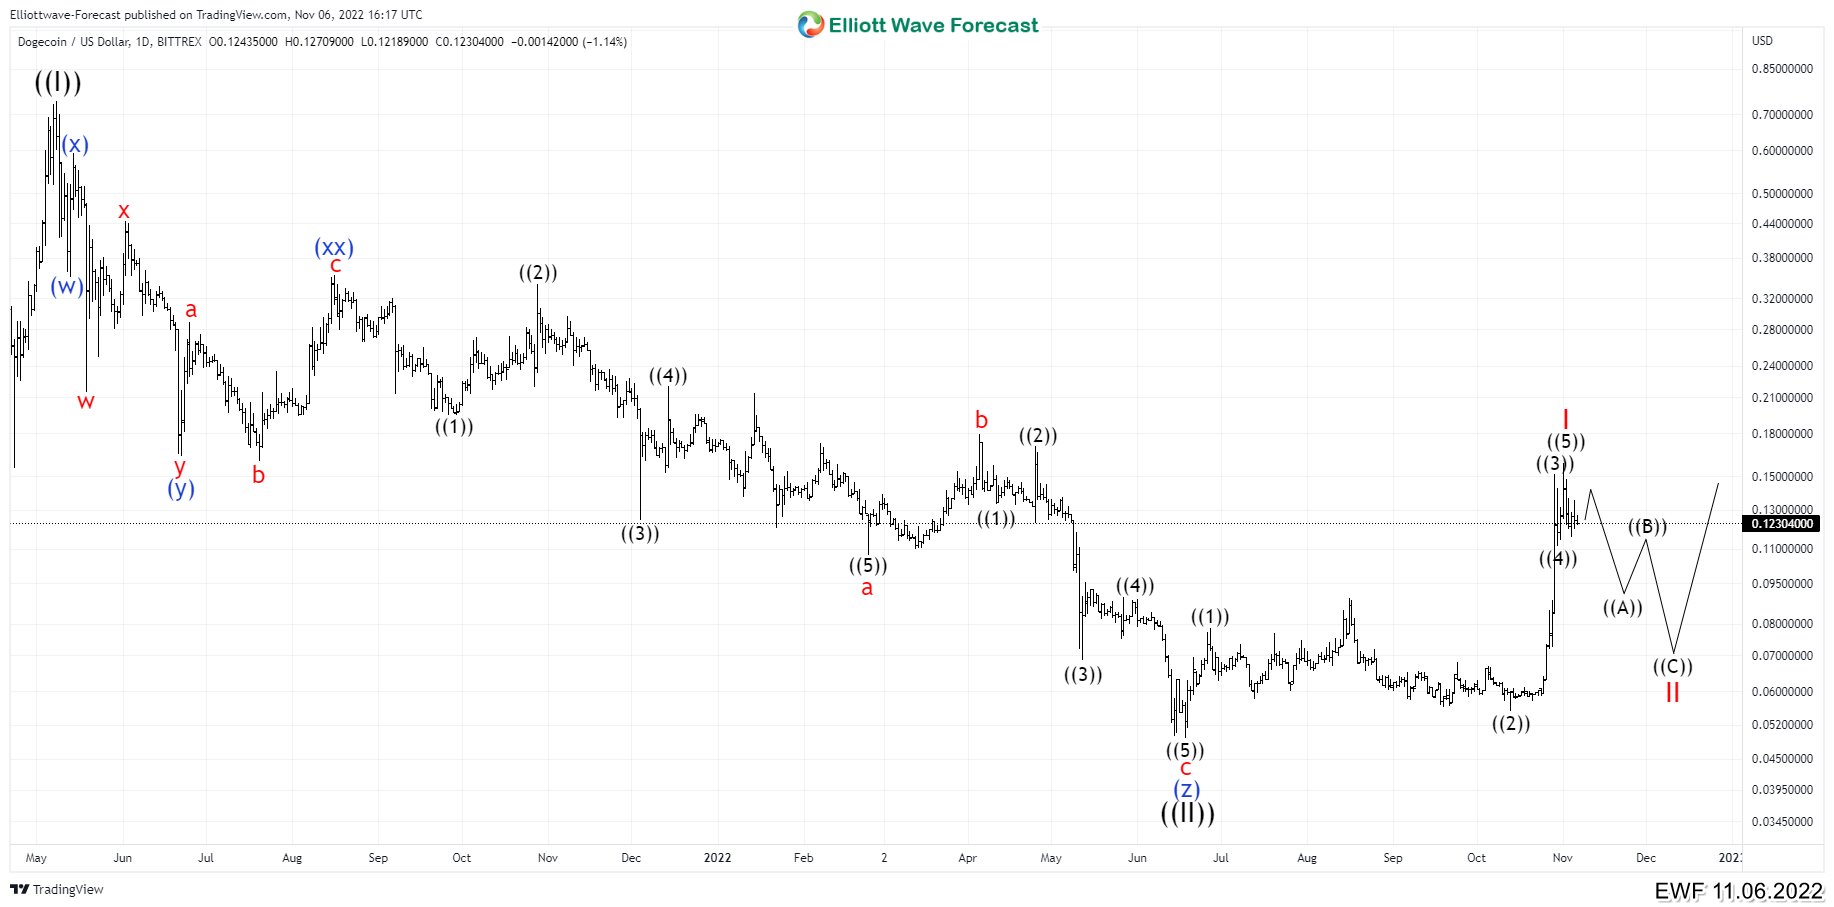
Is A New Bullish Cycle Starting in DOGEUSD From June Low?
Read MoreDOGEUSD promotes the currency as the “fun and friendly Internet currency”. Software engineers Billy Markus and Jackson Palmer launched the satirical cryptocurrency to make fun of Bitcoin and the many other cryptocurrencies boasting grand plans to take over the world. Dogecoin had established a dedicated blog and forum, and its market value has reached US$8 million, once jumping […]