
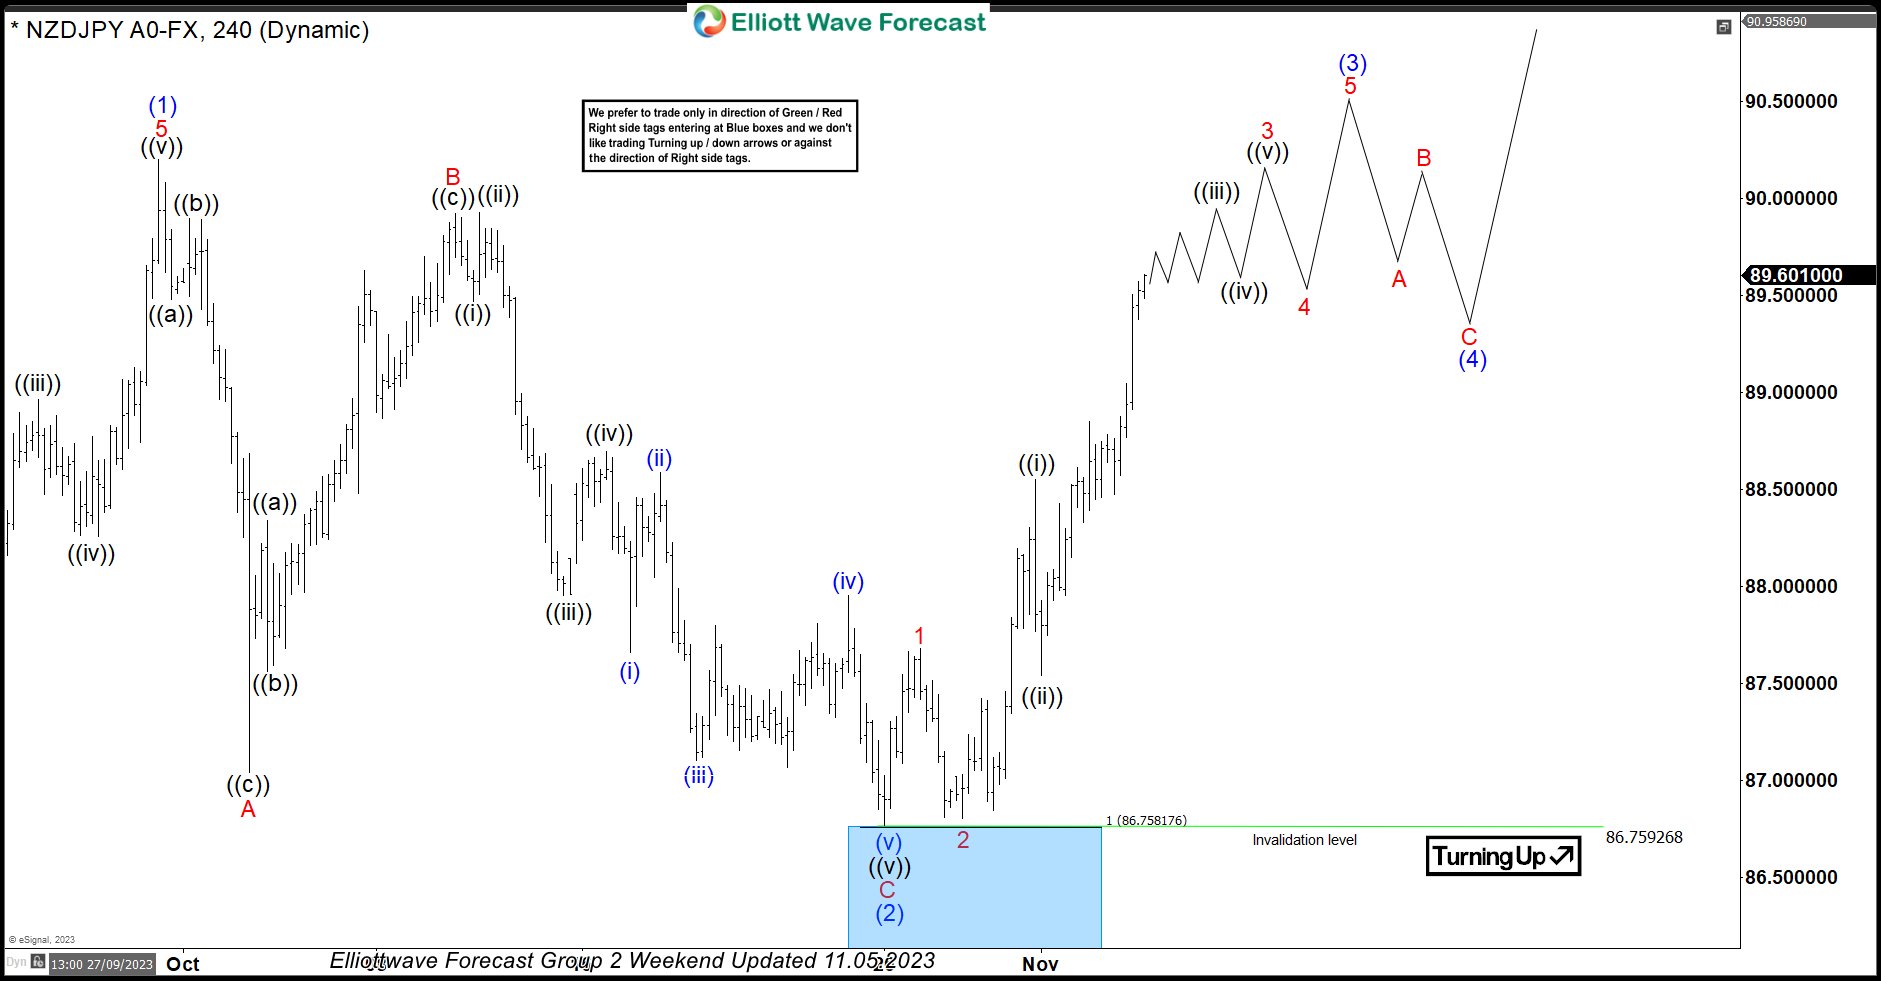
In this technical blog, we will look at the past performance of the 4-hour Elliott Wave Charts of NZDJPY. In which, the rally from 24 March 2023 low unfolded as an impulse sequence and showed a higher high sequence. Therefore, we knew that the structure in NZDJPY is incomplete to the upside & should extend higher. So, […]
-
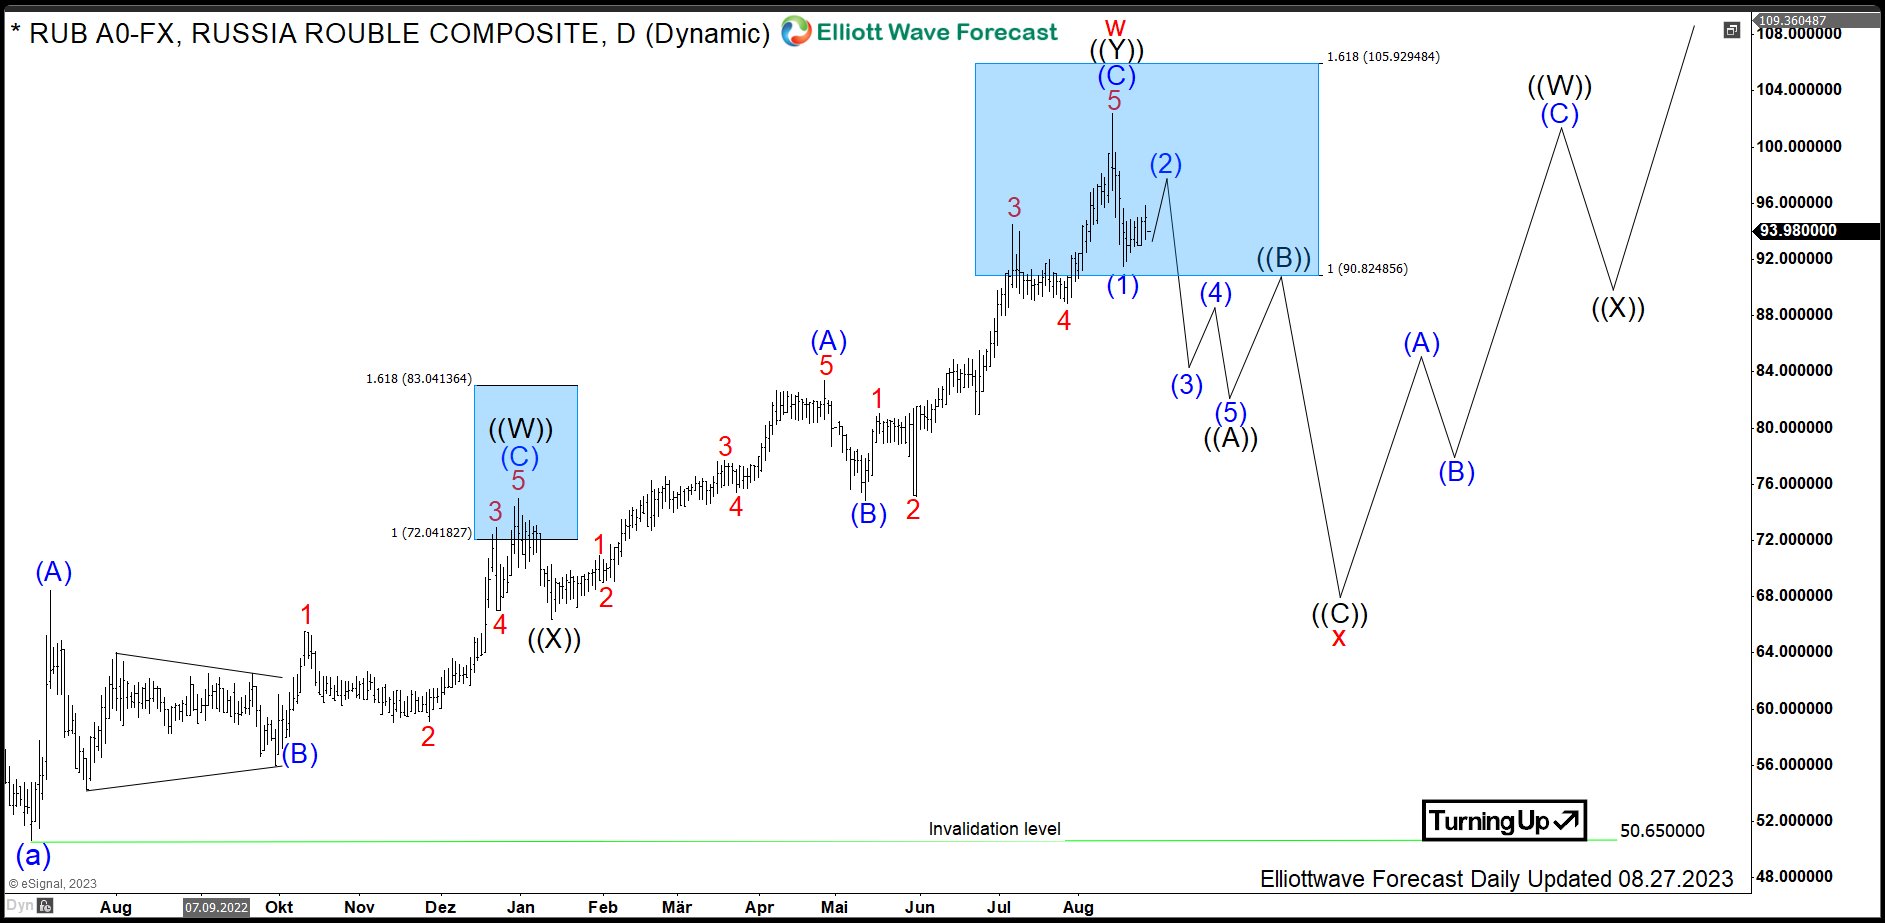
USDRUB : What to Expect from Rouble Reaching Daily Bluebox?
Read MoreRussian Rouble (or Ruble) is the currency of the Russian Federation and the 17th most traded currency in the world. Within current environment of rising commodity prices, the world market impact of Russia, which is a major commodities producer, should strengthen. Without any doubt, this fact will increase the trading volumes of the Russian national […]
-
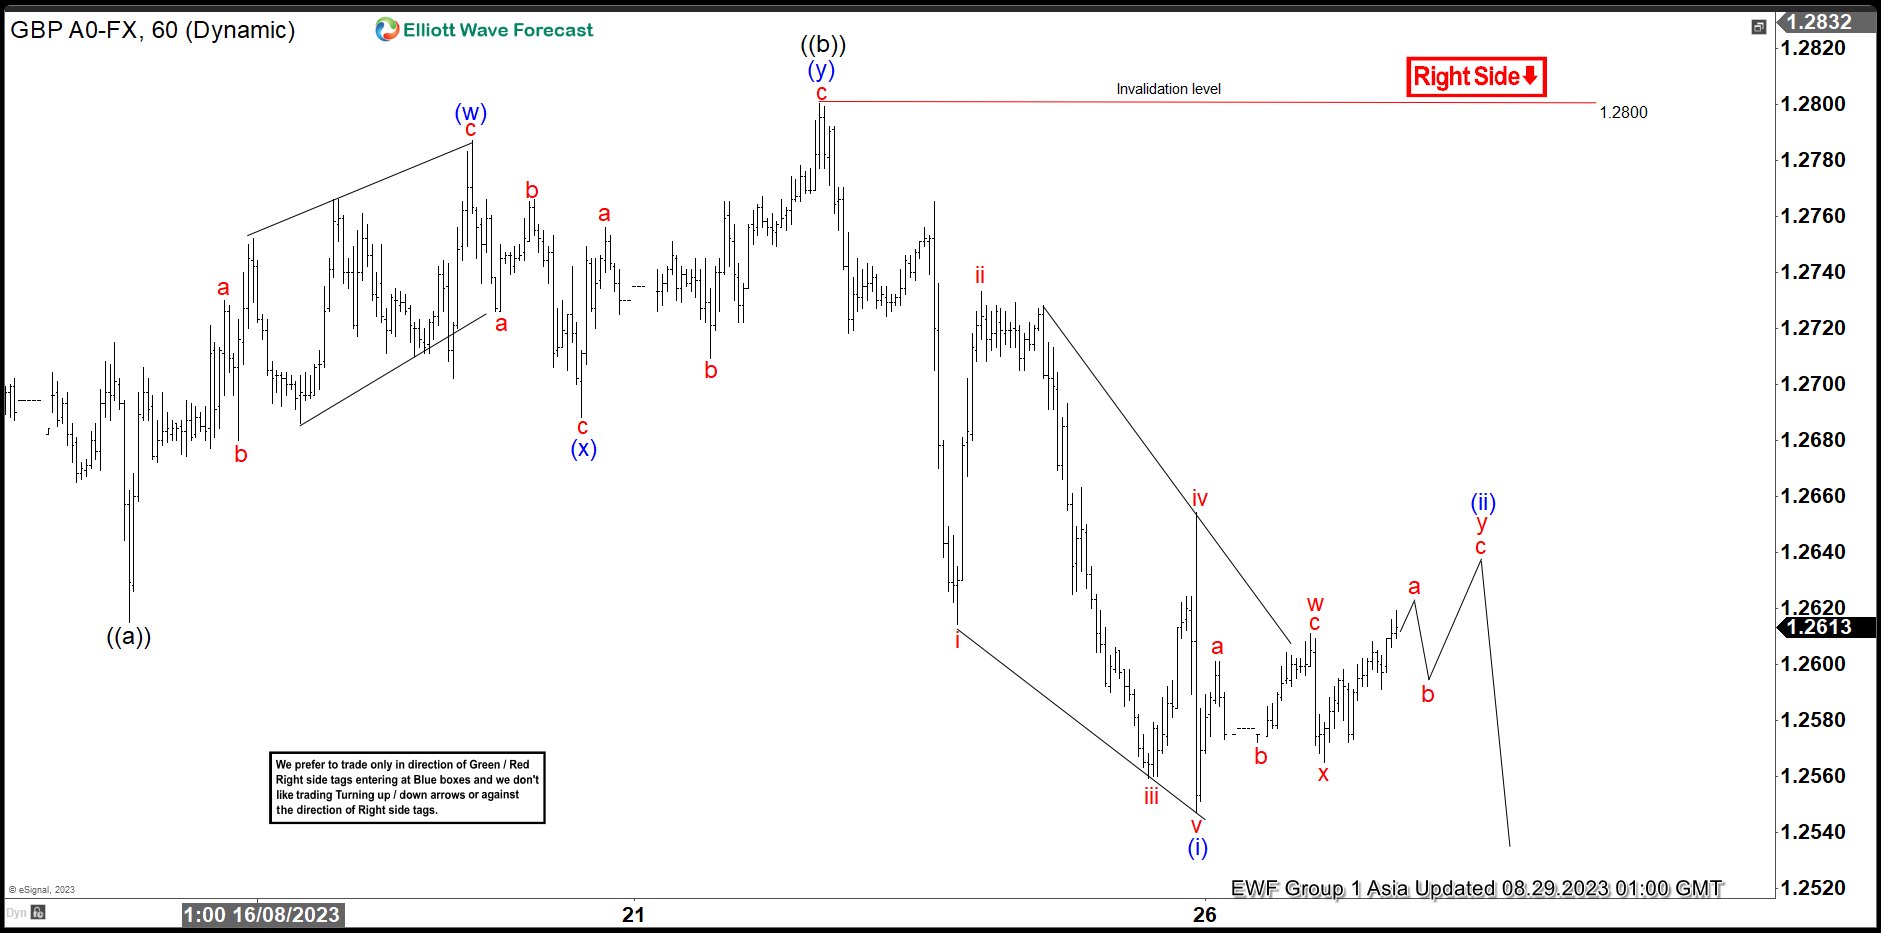
GBPUSD Has Scope to Extend lower in Zigzag Correction
Read MoreGBPUSD is doing larger degree correction in zigzag structure. This article and video look at the Elliott Wave path of the pair.
-
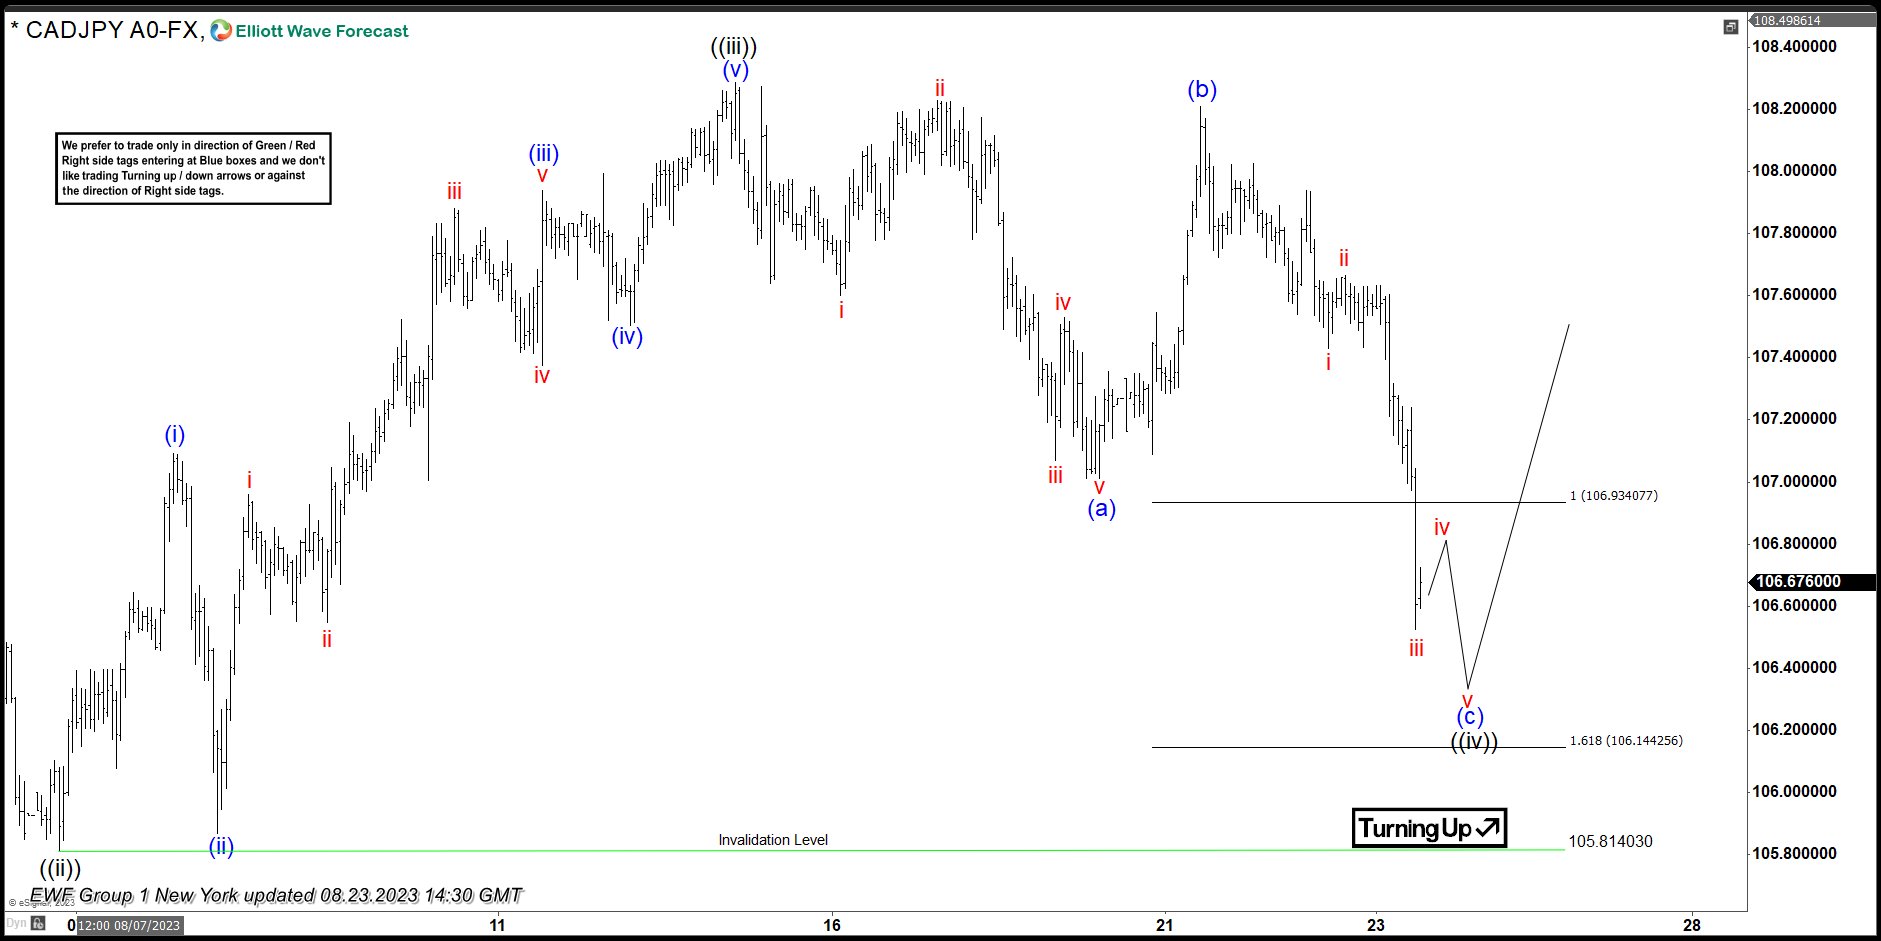
CADJPY Dips Keep Finding Buyers At Equal Legs Area
Read MoreIn this technical blog, we will look at the past performance of the 1-hour Elliott Wave Charts of the CADJPY. The rally from the 28 July 2023 low showed a higher high sequence & provided a short-term extreme trading opportunity. In this case, the pullback managed to reach the equal legs area & provided a […]
-
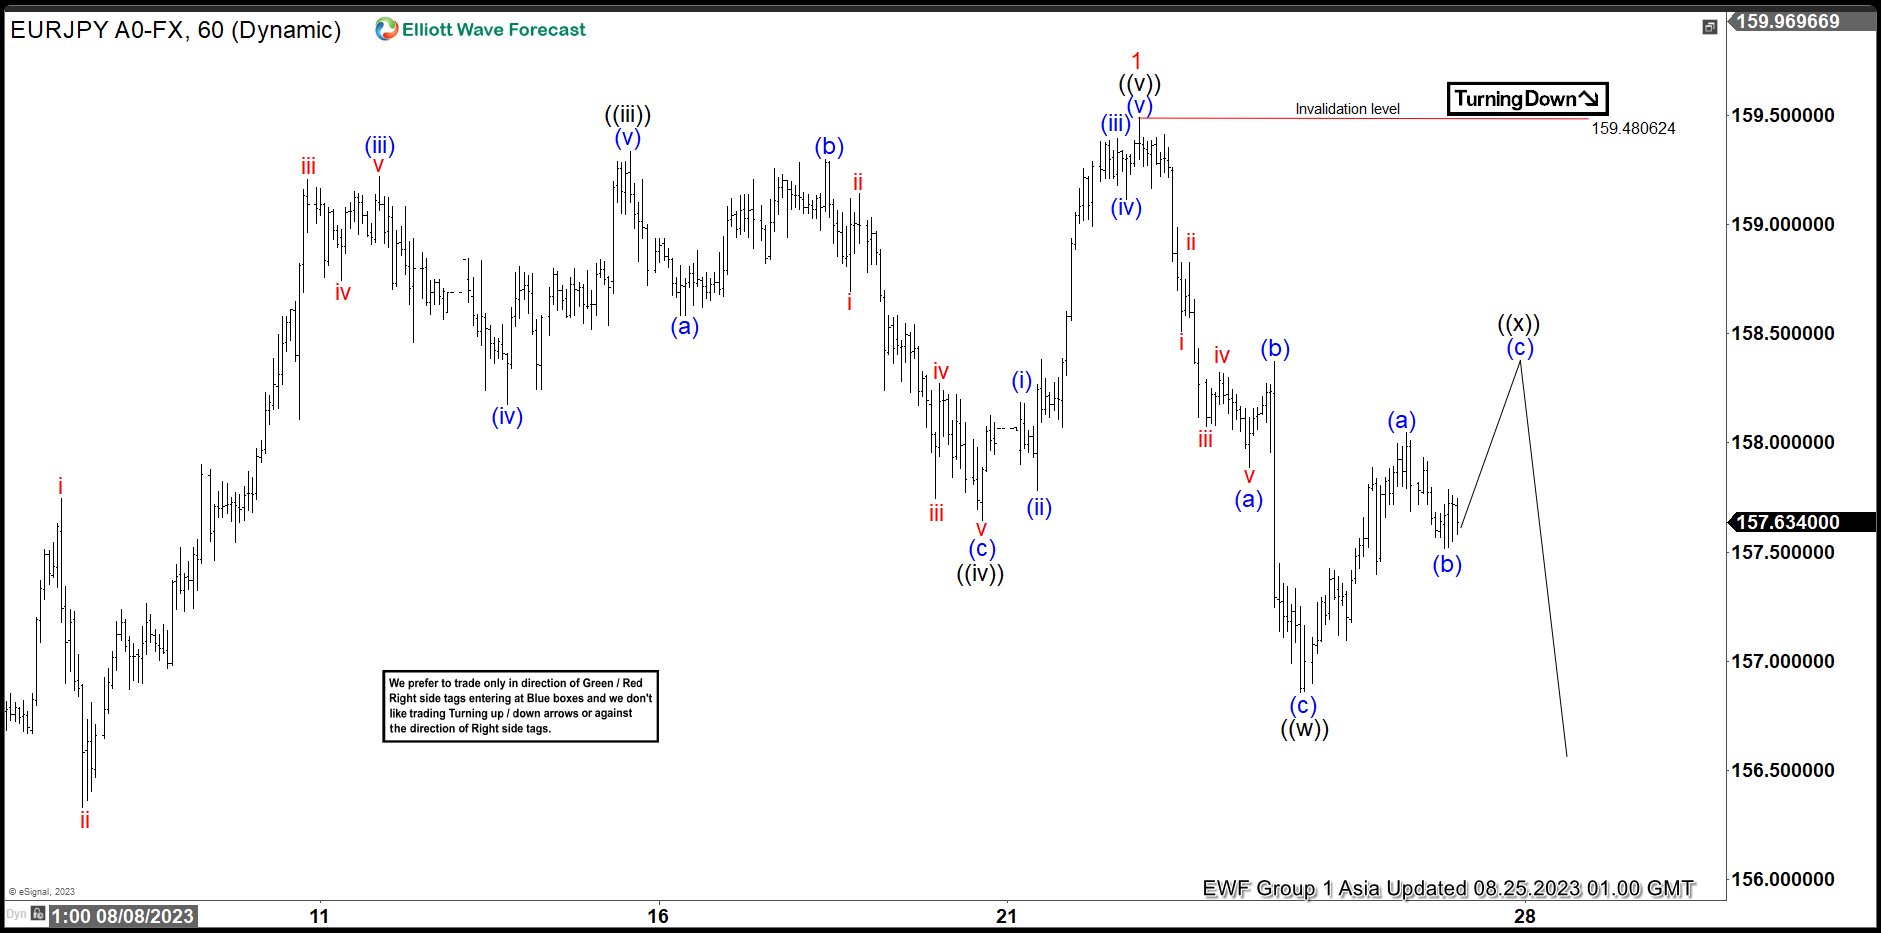
EURJPY Correcting in 7 Swing Within Bullish Trend
Read MoreEURJPY is correcting cycle from 7.28.2023 low as a double three before pair resumes higher. This article and video look at the Elliott Wave path
-
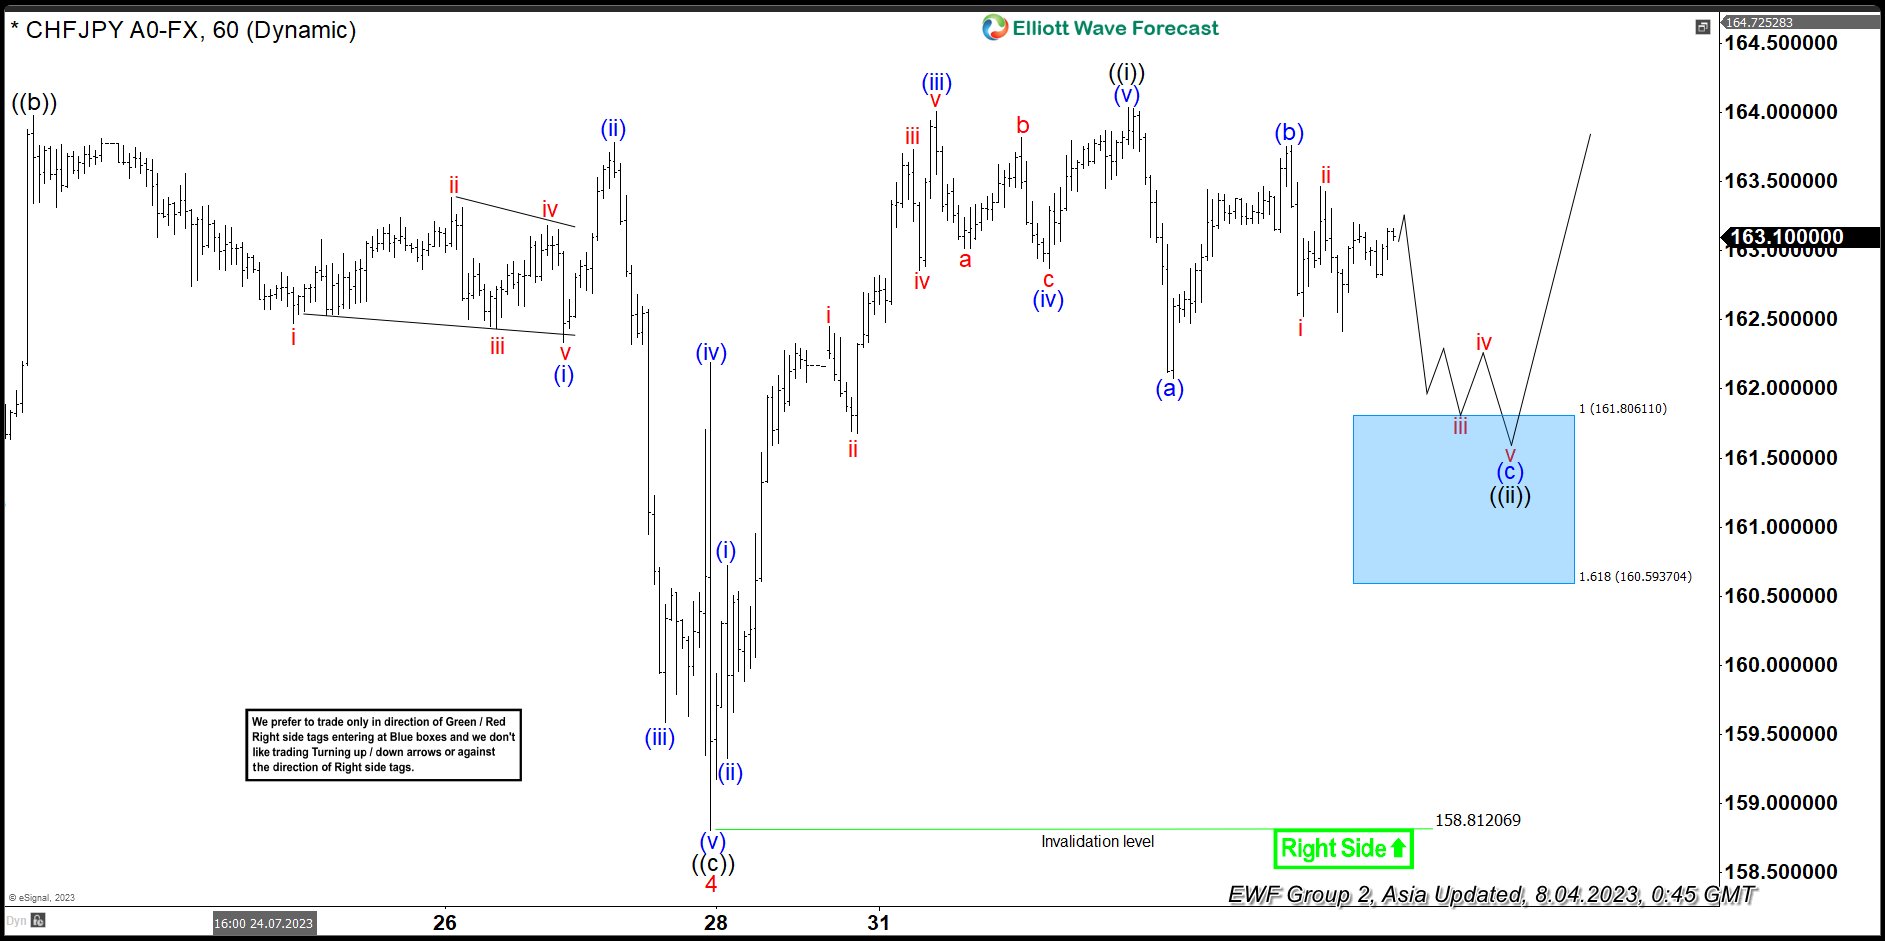
CHFJPY Pullbacks Are Expected To Remain Supported
Read MoreCHFJPY short term pullback from the peak are expected to remain supported in 3, 7 or 11 swings. This article and video look at the Elliott Wave path.
-
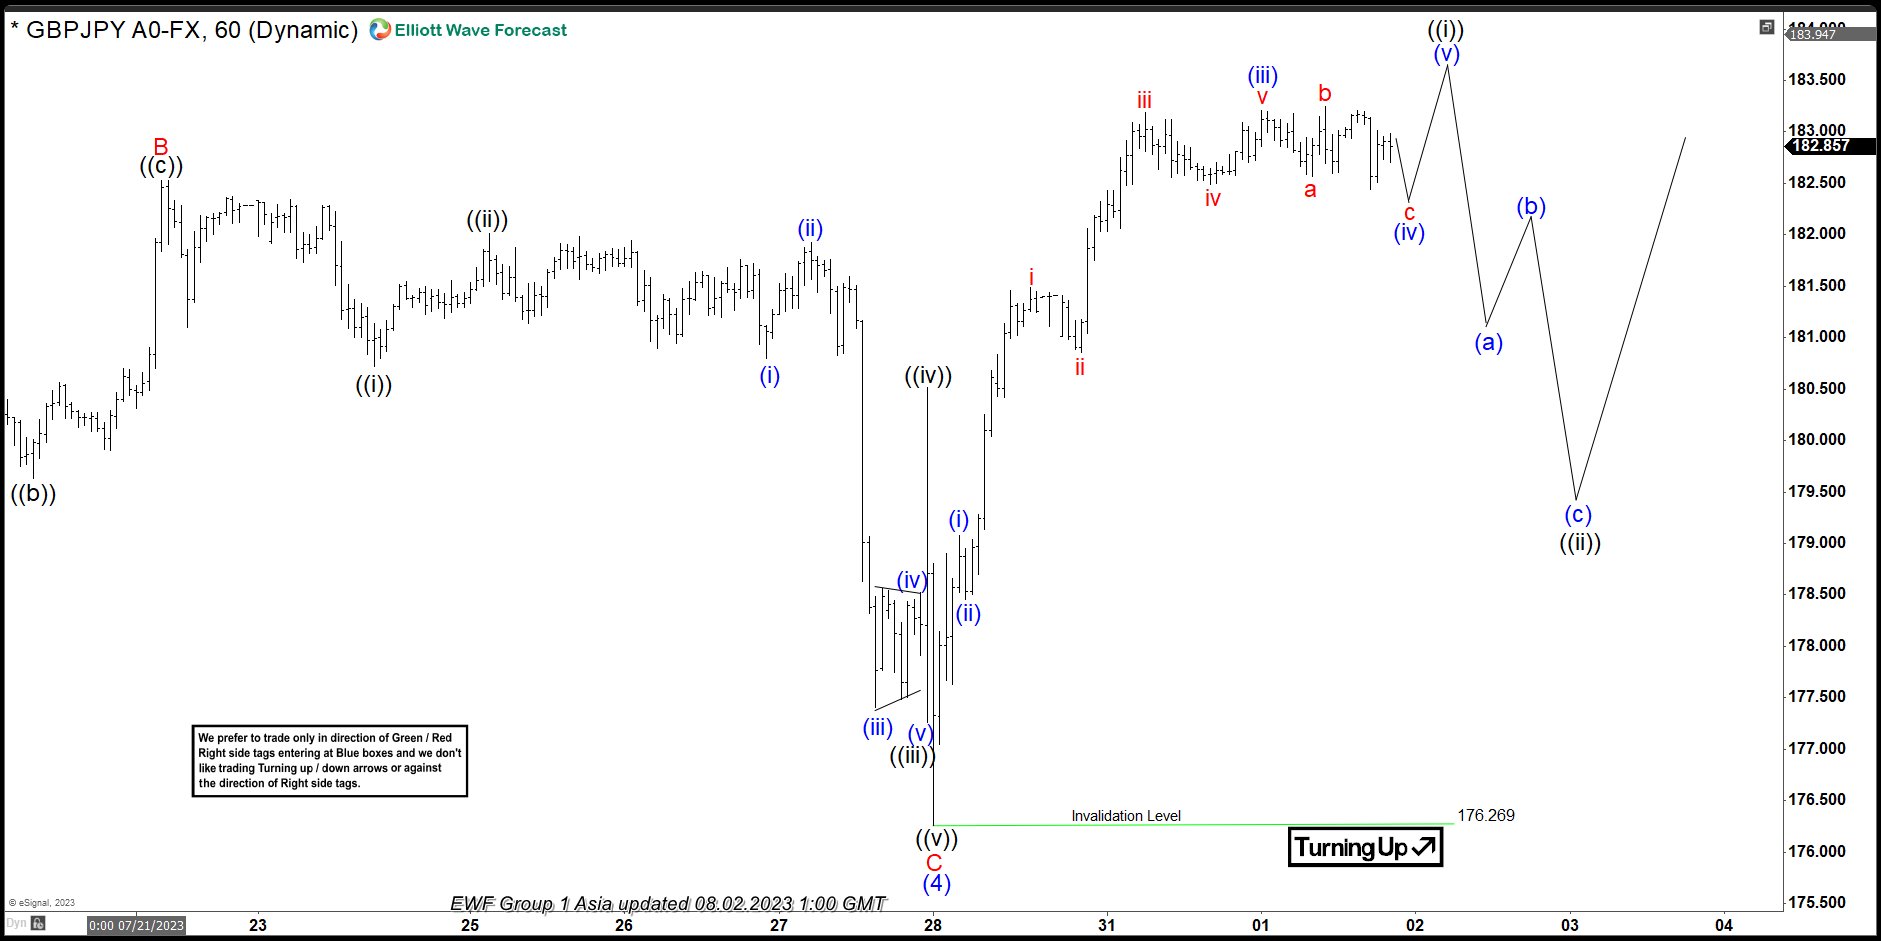
GBPJPY 3 Wave Pullback Coming After ending Impulse Rally
Read MoreGBPJPY the impulse rally from 7/28/2023 low is coming to an end & the pair is due a 3 wave pullback. This article and video look at the Elliott Wave path.