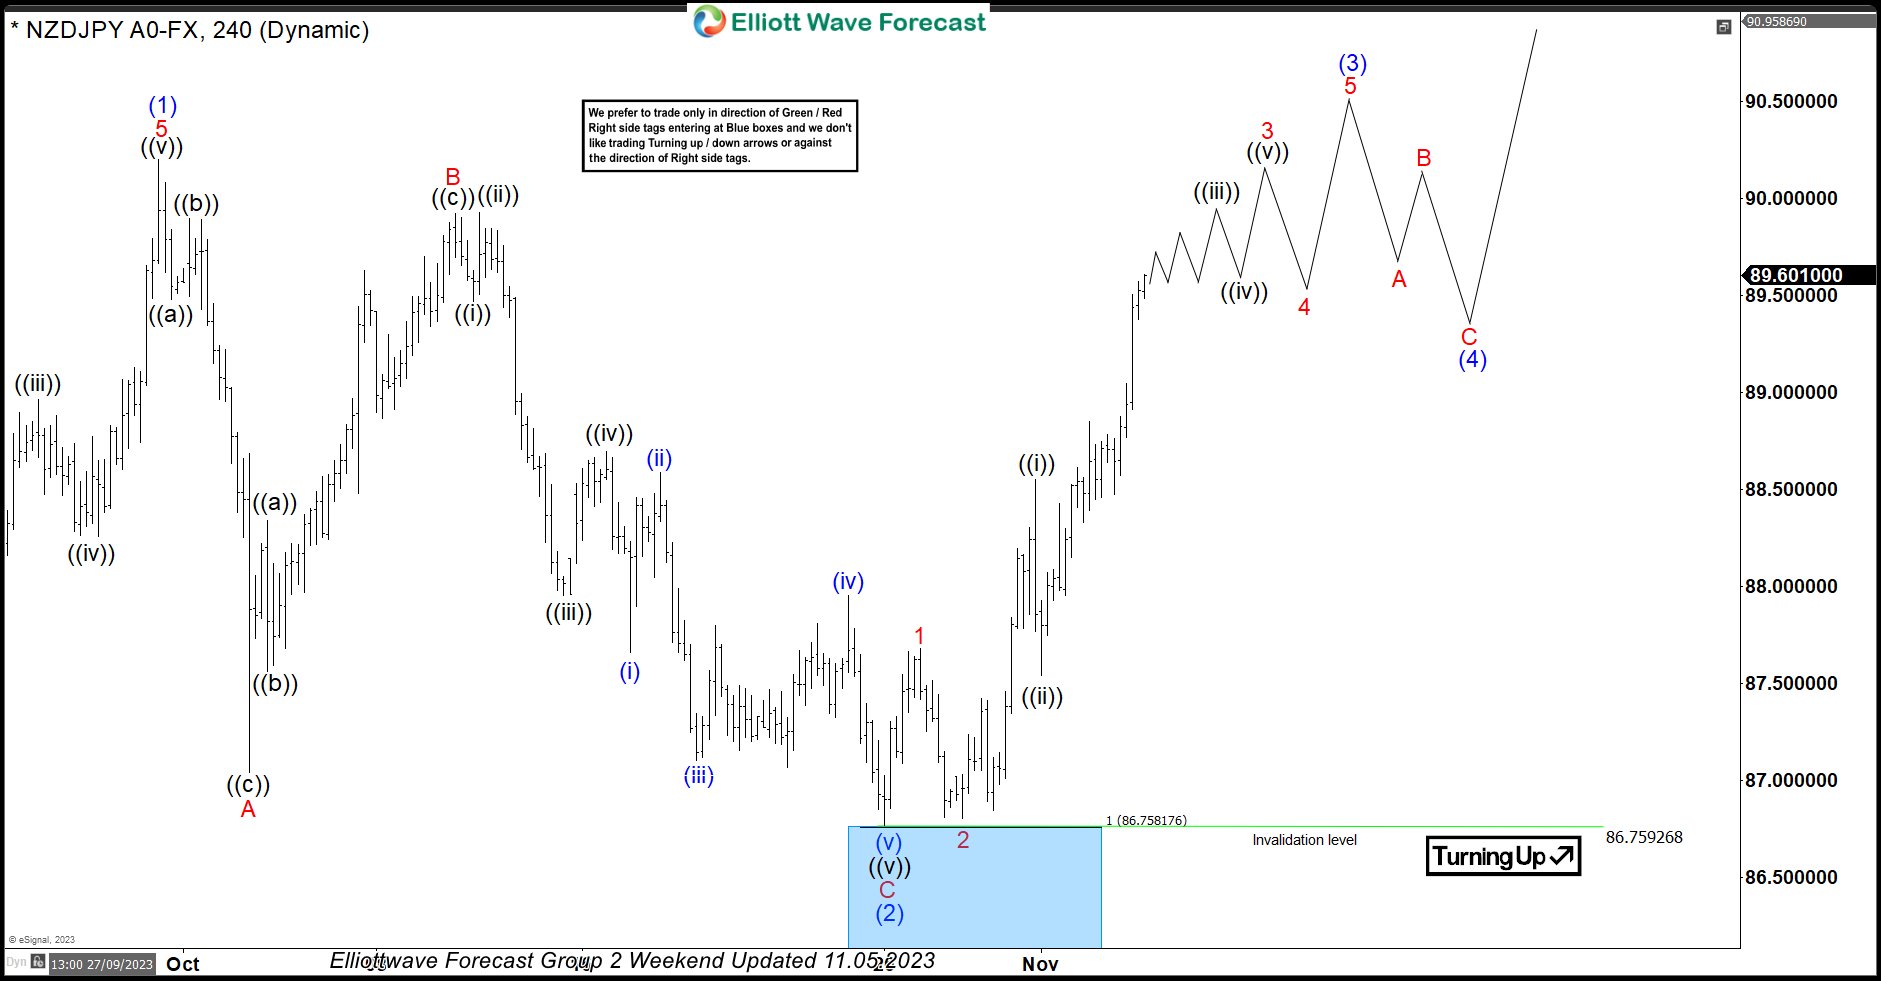

In this technical blog, we will look at the past performance of the 4-hour Elliott Wave Charts of NZDJPY. In which, the rally from 24 March 2023 low unfolded as an impulse sequence and showed a higher high sequence. Therefore, we knew that the structure in NZDJPY is incomplete to the upside & should extend higher. So, […]
-

EWF Live Trading Room
Read MoreIf you were ever curious about our Live Trading Room webinar – here is a video where the host, Dan Hussey, takes you through how the webinar adds to your EWF experience. The room is open daily from 11:30 am EST through 1:30 pm EST and covers everything you need to know to turn the […]
-
$GBPCHF: Elliott Wave B in progress
Read MorePreferred Elliott wave view is that mid-term peak has formed at 1.5123, wave A completed @ 1.4464 and wave B in progress toward 1.4750 – 1.4792 area from where the decline should resume. Rally from 1.4463 – 1.4648 consisted of 7 swings and completed wave (( a )) of B. Pair has already tested 50% […]
-
$EURGBP Wave B in progress
Read MorePair has been trading lower after a test of 0.8400 which we believe completed wave A (cycle from 0.8153 low). Decline so far is in 3 waves so it’s a corrective decline just like the previous updates had been reflecting. Reaction off today’s low suggests wave (( a )) is in place and pair is […]
-

Tracking Cable: GBPUSD
Read MorePair has been trading lower for the last week or so. Let’s take a look at some charts from members area to see how NEW Elliott wave theory called the move lower in GBPUSD pair GBPUSD March 10/2014 (New York Update) GBPUSD March 12/2014 (Mid-day Update) GBPUSD March 13/2014 (London Update) GBPUSD […]
-
$GBPCHF 1 Hour Elliott Wave Analysis
Read MorePreferred view is that mid-term peak has formed at 1.5123, wave A completed @ 1.4464 and wave B in progress toward 1.4700 – 1.4750 area from where the decline should resume. We don’t like buying the pair in proposed push higher as the move up from the low is so far in 3 waves. Click HERE to […]
-

$EURGBP: Elliott Wave Analysis
Read MoreEURGBP is close to ending a cycle on 1 hour time frame. Short-term pair is consolidating in a triangle which is valid as far as price stays above 0.8327 low. As this level holds, expect a push higher toward 0.8400 – 0.8420 area to complete wave A and a pull back in wave B should […]